October 11, 2025 a 11:44 am

CPAY: Fibonacci Analysis - Corpay, Inc.
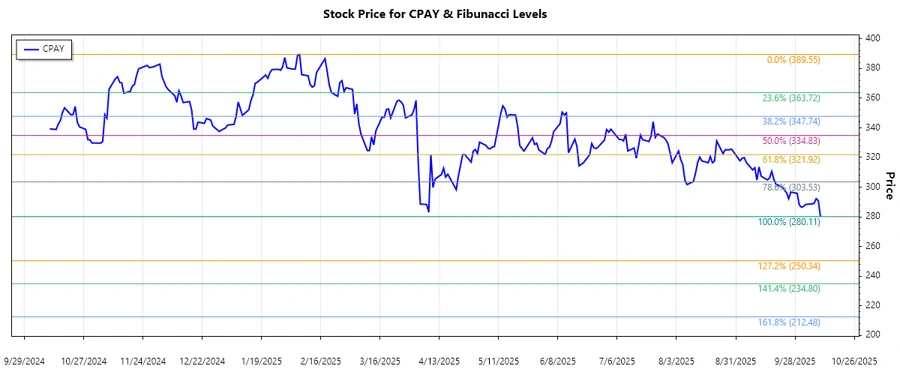
Corpay, Inc. (CPAY), a major player in the payment solutions sector, has witnessed significant volatility over recent months. The company's stock trends reveal crucial insights into its potential market trajectory. Technical analysis suggests a recent bearish trend which could signal caution for investors. Fibonacci analysis will highlight potential levels of support and resistance for the stock.
Fibonacci Analysis
The recent trend for Corpay, Inc. (CPAY) is identified as a downward trend based on historical data spanning several months.
| Detail | Value |
|---|---|
| Start Date | 2025-02-05 |
| End Date | 2025-10-10 |
| High Price | 389.55 (2025-02-06) |
| Low Price | 280.11 (2025-10-10) |
Fibonacci Levels:
| Level | Price |
|---|---|
| 0.236 | 316.44 |
| 0.382 | 336.22 |
| 0.5 | 349.83 |
| 0.618 | 363.45 |
| 0.786 | 383.72 |
The current price is $280.11, which does not fall within any of the significant Fibonacci retracement levels, indicating it is not in a retracement zone.
Technical interpretation suggests that if the stock encounters the lower Fibonacci levels, they may serve as potential resistance in an ongoing downward market trend.
Conclusion
The Fibonacci analysis indicates that Corpay, Inc. (CPAY) is currently experiencing a downward trajectory, with potential resistance levels identified through its Fibonacci retracement. The stock's current position outside key retracement zones could suggest further downside risks. However, should the price approach any Fibonacci level, it could present a crucial test of market sentiment, potentially offering support or resistance cues. Investors should weigh these technical insights against macro factors and Corpay's operational performance before making investment decisions. Nonetheless, vigilance is advised given the volatility in payment solutions markets.
Smart Data Insight
Master the Perfect Entry & Exit for this Stock
Don't leave your profits to chance. Historically, this stock follows specific seasonal patterns that institutional traders use to maximize returns.
- ✅ Identify the "Golden Buying Window"
- ✅ Avoid high-risk correction cycles
- ✅ Backtested data from the last 20+ years