
July 06, 2026 a 04:44 pm
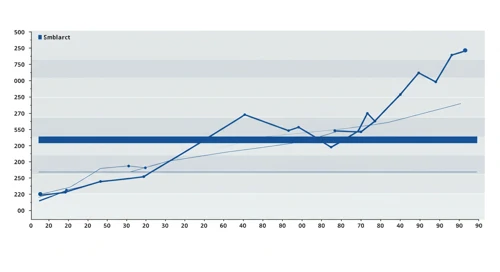

COST: Fibonacci Analysis - Costco Wholesale Corporation
Costco Wholesale Corporation's stock has shown recent fluctuations, posing an intriguing opportunity for investors. Despite short-term volatilities, the long-term outlook seems stable, driven by the company's consistent expansion and diverse product offerings.
Fibonacci Analysis
| Period | Value |
|---|---|
| Start Date | 2025-11-05 |
| End Date | 2026-07-06 |
| High Price | 1094.32 (2026-05-19) |
| Low Price | 882.58 (2026-01-07) |
| Fibonacci Level | Price Level |
|---|---|
| 0.236 | 928.39 |
| 0.382 | 965.30 |
| 0.5 | 988.45 |
| 0.618 | 1011.60 |
| 0.786 | 1043.35 |
The current price sits within the 0.382 retracement zone, indicating potential support at this level. Technically, this could suggest imminent resistance if the price moves downward or a strong support if prices maintain above the 0.382 level.
Conclusion
Costco's stock has shown resilience amid market volatilities, largely attributed to its widespread operational footprint and diversified product range. The identified support level at the 0.382 retracement suggests a technical rebound might be possible. However, cautious investors should monitor the market for potential further downturns. The company's robust growth strategies provide a buffer against transient market disturbances, yet external economic factors remain a risk. Analysts are optimistic but remain vigilant of macroeconomic impacts on retail dynamics.
Smart Data Insight
Master the Perfect Entry & Exit for this Stock
Don't leave your profits to chance. Historically, this stock follows specific seasonal patterns that institutional traders use to maximize returns.
- ✅ Identify the "Golden Buying Window"
- ✅ Avoid high-risk correction cycles
- ✅ Backtested data from the last 20+ years