March 22, 2026 a 03:31 pm


COST: Dividend Analysis - Costco Wholesale Corporation
Costco exhibits a long-standing commitment to returning value to shareholders through consistent dividend payments. Despite a relatively low dividend yield, the company's strong fundamentals and disciplined financial management suggest sustained payout capability. Current payout ratios indicate room for potential increases without jeopardizing financial health.
📊 Overview
Costco operates in the Consumer Goods Sector, maintaining a stable presence in the industry with a notable history of dividend payments. The current dividend yield stands at a modest 0.55%, reflecting its premium valuation in the market. Historically, Costco has maintained dividend payouts for 23 years without any recent cuts or suspensions.
| Metric | Value |
|---|---|
| Sector | Consumer Goods |
| Dividend yield | 0.55% |
| Current dividend per share | $4.92 USD |
| Dividend history | 23 years |
| Last cut or suspension | None |
🗣️ Dividend History
The longevity and consistency of Costco's dividend payments are testaments to its solid financial foundation. This historical perspective is vital for investors seeking stable income and confidence in continued distributions.
| Year | Dividend per Share (USD) |
|---|---|
| 2026 | $1.30 |
| 2025 | $5.06 |
| 2024 | $4.50 |
| 2023 | $18.96 |
| 2022 | $3.49 |
📈 Dividend Growth
Dividend growth reflects the company's ability to increase payouts, a key factor for dividend investors. Costco's average dividend growth is slightly negative over five years but shows a positive trend over the last three years.
| Time | Growth |
|---|---|
| 3 years | 13.18% |
| 5 years | -16.88% |
The average dividend growth is -16.88% over 5 years. This shows moderate but steady dividend growth.
⚠️ Payout Ratio
Payout ratios offer a snapshot of dividend sustainability relative to earnings and free cash flow. Analyzing these ratios helps assess Costco's capacity to maintain or increase its dividends.
| Key figure | Ratio |
|---|---|
| EPS-based | 25.53% |
| Free cash flow-based | 23.97% |
With a 25.53% EPS payout ratio and 23.97% FCF payout ratio, Costco maintains conservative dividend distributions that suggest sufficient earnings and cash flow coverage.
🏦 Cashflow & Capital Efficiency
Evaluating cash flow dynamics and capital deployment efficiency is crucial to understanding Costco's operational robustness. Below is an analysis based on key performance metrics.
| Year | 2023 | 2024 | 2025 |
|---|---|---|---|
| Free Cash Flow Yield | 2.79% | 1.67% | 1.87% |
| Earnings Yield | 2.60% | 1.86% | 1.93% |
| CAPEX to Operating Cash Flow | 39.06% | 41.54% | 41.23% |
| Stock-based Compensation to Revenue | 0.32% | 0.32% | 0.31% |
| Free Cash Flow / Operating Cash Flow Ratio | 60.94% | 58.46% | 58.77% |
Costco's metrics reveal a consistent generation of cash flow, underscoring strong capital efficiency and stable free cash flow ratios contributing to its financial resilience.
🧾 Balance Sheet & Leverage Analysis
Assessing balance sheet health involves evaluating liquidity and leverage ratios to understand the financial stability and debt management of Costco.
| Year | 2023 | 2024 | 2025 |
|---|---|---|---|
| Debt-to-Equity | 35.45% | 35.02% | 28.02% |
| Debt-to-Assets | 12.88% | 11.85% | 10.60% |
| Debt-to-Capital | 26.17% | 25.94% | 21.89% |
| Net Debt to EBITDA | -0.45 | -0.13 | -0.45 |
| Current Ratio | 1.06 | 0.97 | 1.03 |
| Quick Ratio | 0.57 | 0.44 | 0.55 |
| Financial Leverage | 2.75 | 2.96 | 2.64 |
Costco's balance sheet indicates prudent leverage management with moderate debt ratios relative to equity and assets—highlighting financial flexibility and low leverage risk.
📈 Fundamental Strength & Profitability
Fundamental assessment showcases Costco's profitability and business efficiency, critical factors for long-term growth and sustainability.
| Year | 2023 | 2024 | 2025 |
|---|---|---|---|
| Return on Equity | 25.11% | 31.19% | 27.77% |
| Return on Assets | 9.12% | 10.55% | 10.50% |
| Net Margin | 2.60% | 2.90% | 2.94% |
| EBIT Margin | 3.57% | 3.89% | 3.99% |
| EBITDA Margin | 4.43% | 4.77% | 4.87% |
| Gross Margin | 12.26% | 12.61% | 12.83% |
| Research & Development to Revenue | 0% | 0% | 0% |
The strong return metrics and consistent margins reflect Costco's ability to efficiently convert revenue into profit, reinforcing its competitive positioning and profitability.
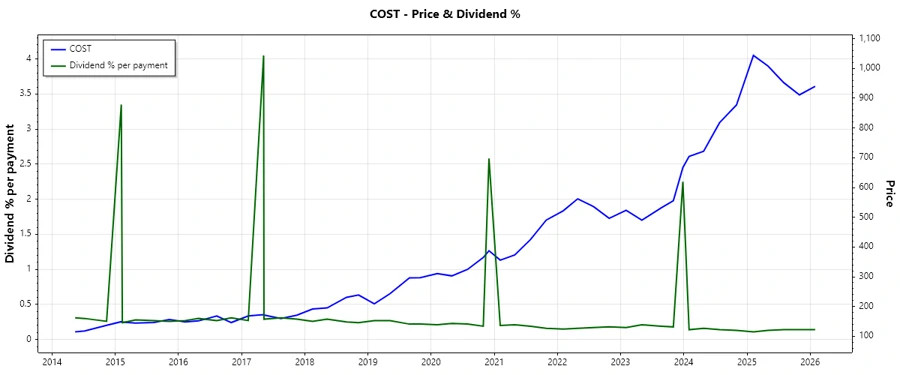
📉 Price Development
✅ Dividend Scoring System
| Criteria | Score (out of 5) | Score Bar |
|---|---|---|
| Dividend yield | 2 | |
| Dividend Stability | 5 | |
| Dividend growth | 3 | |
| Payout ratio | 5 | |
| Financial stability | 5 | |
| Dividend continuity | 5 | |
| Cashflow Coverage | 4 | |
| Balance Sheet Quality | 4 |
Overall Score: 33 out of 40
🗣️ Rating
Despite its low yield, Costco's investment in dividend stability and growth potential makes it an attractive addition to a diversified portfolio. Given its robust financial health, shareholders can expect reliable returns through sustained dividend payments. Recommended for income-focused investors prioritizing stability and growth in their investment strategy.