December 02, 2025 a 03:31 am

COST: Dividend Analysis - Costco Wholesale Corporation
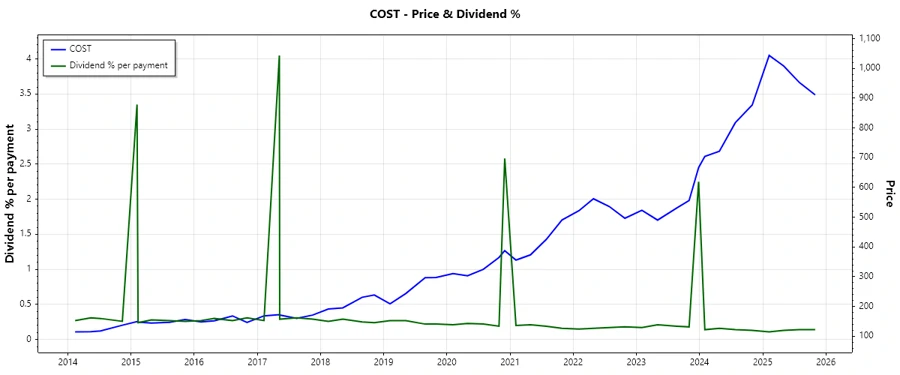
Costco Wholesale Corporation presents an intriguing dividend profile characterized by a relatively modest dividend yield. Despite a recent cut or suspension in 2024, its dividend history extends impressively over 22 years, indicating a level of resilience. Investors might find the combination of stable growth and strategic dividend management appealing.
📊 Overview
Costco operates within the Consumer Staples sector, which commonly exhibits defensive characteristics. The dividend metrics reveal a current dividend yield of 0.56%, reflecting a cautious distribution policy primarily aimed at maintaining sustainable payouts.
| Aspect | Details |
|---|---|
| Sector | Consumer Staples |
| Dividend yield | 0.56% |
| Current dividend per share | 4.92 USD |
| Dividend history | 22 years |
| Last cut or suspension | 2024 |
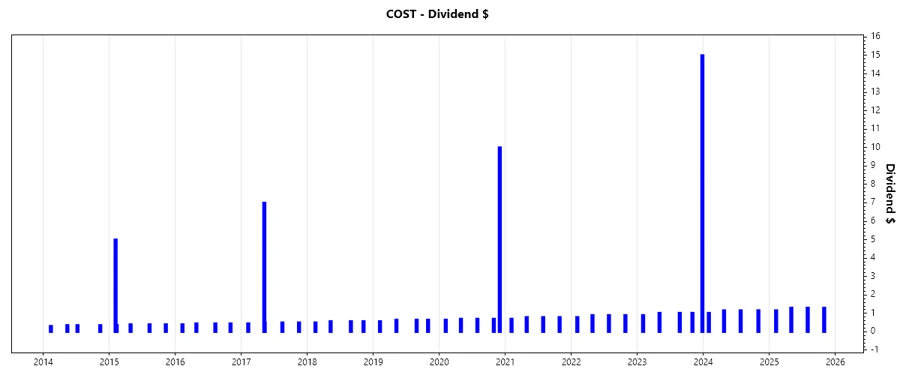
📈 Dividend History
Costco's dividend history is marked by consistent distributions, a signal of its financial robustness. This record acts as an assurance of the company's commitment to shareholder returns, despite a recent cut or suspension.
| Year | Dividend per Share (USD) |
|---|---|
| 2025 | 5.06 |
| 2024 | 4.50 |
| 2023 | 18.96 |
| 2022 | 3.49 |
| 2021 | 3.07 |
📈 Dividend Growth
Costco exhibits modest but notable dividend growth with a 13.60% increase over the past three years, underscoring its strategic focus on returning value to shareholders. This growth trajectory is advantageous for investors seeking incremental income growth.
| Time | Growth |
|---|---|
| 3 years | 13.60% |
| 5 years | 12.30% |
The average dividend growth is 12.30% over 5 years. This shows moderate but steady dividend growth.
🗣️ Payout Ratio
The payout ratios are critical as they determine the sustainability of dividend payments. Costco maintains a conservative EPS-based payout ratio of 27% and a similar figure for Free Cash Flow, ensuring flexibility for reinvestment and unforeseen expenditures.
| Key figure ratio | Percentage |
|---|---|
| EPS-based | 27% |
| Free cash flow-based | 28% |
These payout ratios indicate a prudent balance between rewarding shareholders and retaining earnings for future growth.
💡 Cashflow & Capital Efficiency
Evaluating cash flow and capital efficiency is essential in understanding Costco’s ability to sustain dividends and finance operations. A strong Free Cash Flow to Operating Cash Flow Ratio assures stability, although CAPEX to Operating Cash Flow suggests ongoing capital investments.
| Metric | 2025 | 2024 | 2023 |
|---|---|---|---|
| Free Cash Flow Yield | 1.87% | 1.67% | 2.77% |
| Earnings Yield | 1.93% | 1.86% | 2.58% |
| CAPEX to Operating Cash Flow | 41% | 41% | 39% |
| Stock-based Compensation to Revenue | 0.31% | 0.32% | 0.32% |
| Free Cash Flow / Operating Cash Flow Ratio | 58% | 58% | 61% |
The data reflects well-managed cash flow practices, aligning CAPEX with cash generation.
📊 Balance Sheet & Leverage Analysis
Costco's leverage ratios provide insight into its financial stability and risk exposure. A low Debt-to-Equity and significant interest coverage suggest manageable leverage.
| Metric | 2025 | 2024 | 2023 |
|---|---|---|---|
| Debt-to-Equity | 28% | 35% | 35% |
| Debt-to-Assets | 11% | 12% | 13% |
| Debt-to-Capital | 22% | 26% | 26% |
| Net Debt to EBITDA | -0.45 | -0.13 | -0.43 |
| Current Ratio | 1.03 | 0.97 | 1.07 |
| Quick Ratio | 0.55 | 0.44 | 0.57 |
| Financial Leverage | 2.64 | 2.96 | 2.75 |
Costco has a solid financial structure, indicating low financial distress risks and good liquidity management.
📈 Fundamental Strength & Profitability
Assessing profitability and fundamental strength reveals Costco's competitive advantage and efficiency in utilizing assets for returns.
| Metric | 2025 | 2024 | 2023 |
|---|---|---|---|
| Return on Equity | 27.77% | 31.19% | 25.11% |
| Return on Assets | 10.50% | 10.55% | 9.12% |
| Net Margin | 2.94% | 2.90% | 2.60% |
| EBIT Margin | 3.99% | 3.89% | 3.57% |
| EBITDA Margin | 4.87% | 4.77% | 4.60% |
| Gross Margin | 12.84% | 12.61% | 12.26% |
| R&D to Revenue | 0.00% | 0.00% | 0.00% |
Costco showcases robust profitability metrics alongside efficient asset management, affirming its strong market position.
⚠️ Price Development
✅ Dividend Scoring System
| Category | Score | Bar |
|---|---|---|
| Dividend yield | 3 | |
| Dividend Stability | 4 | |
| Dividend growth | 3 | |
| Payout ratio | 4 | |
| Financial stability | 5 | |
| Dividend continuity | 4 | |
| Cashflow Coverage | 4 | |
| Balance Sheet Quality | 5 |
Total Score: 32/40
🗣️ Rating
Costco exhibits a resilient and stable dividend policy, underpinned by moderate growth and robust financial health. While the yield remains on the lower side, the company's strategic management, financial stability, and high-quality balance sheet position it as a solid investment for long-term income seekers. Given the company’s proven ability to navigate market cycles, Costco holds a favorable outlook for dividend investors.