
July 04, 2026 a 11:43 am

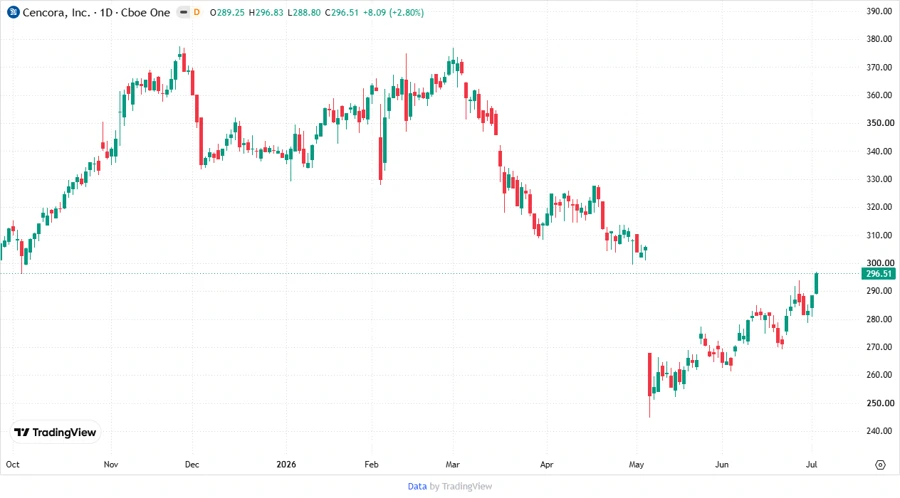
COR: Fundamental Ratio Analysis - Cencora, Inc.
Cencora, Inc. has a diverse and robust business model strongly embedded in the healthcare sector. The company's expansive operations in pharmaceutical distribution are complemented by its strategic services, extending its market impact. Despite its strong footing, investors should weigh the cyclicality of healthcare demand and potential regulatory implications.
Fundamental Rating
The fundamental analysis shows a balanced risk-reward profile evidenced by strong returns on equity and assets, though partially offset by higher debt levels.
| Category | Score | Visualization |
|---|---|---|
| Discounted Cash Flow | 5 | |
| Return on Equity | 5 | |
| Return on Assets | 3 | |
| Debt to Equity | 1 | |
| Price to Earnings | 2 | |
| Price to Book | 1 |
Historical Rating
The historical data shows consistent scoring patterns, indicating stable performance metrics over time, conducive to long-term investment potential.
| Date | Overall | DCF | ROE | ROA | D/E | P/E | P/B |
|---|---|---|---|---|---|---|---|
| 2026-07-02 | 3 | 5 | 5 | 3 | 1 | 2 | 1 |
| Previous | - | - | - | - | - | - | - |
Analyst Price Targets
Price targets are optimistic, led by a high consensus indicating potential room for upside if market conditions align positively.
| High | Low | Median | Consensus |
|---|---|---|---|
| $440 | $331 | $360 | $378.57 |
Analyst Sentiment
Analyst sentiment reflects a predominantly bullish outlook, with a majority recommending buy positions despite a few hold and sell recommendations.
| Recommendation | Count | Visualization |
|---|---|---|
| Strong Buy | 0 | |
| Buy | 33 | |
| Hold | 12 | |
| Sell | 1 | |
| Strong Sell | 0 |
Conclusion
Cencora, Inc. presents a compelling investment case due to its strategic positioning in the healthcare distribution sector and resilient financial performance. Strong fundamentals, reflected in favorable analyst sentiment and optimistic price targets, suggest potential growth. However, investors should remain vigilant of the company's debt levels and any adverse changes in the regulatory landscape. The firm's global operations further underscore its potential, albeit with inherent exposure to foreign market risks and currency fluctuation.
Smart Data Insight
Master the Perfect Entry & Exit for this Stock
Don't leave your profits to chance. Historically, this stock follows specific seasonal patterns that institutional traders use to maximize returns.
- ✅ Identify the "Golden Buying Window"
- ✅ Avoid high-risk correction cycles
- ✅ Backtested data from the last 20+ years