November 27, 2025 a 05:15 am

COR: Fibonacci Analysis - Cencora, Inc.
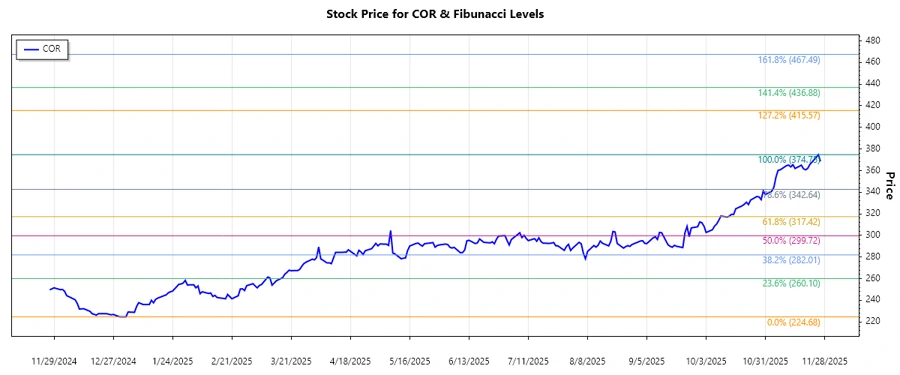
Cencora, Inc. has exhibited a consistent uptrend over recent months. The stock has shown resilience against market fluctuations, indicating strong investor confidence. It is crucial to analyze key retracement levels to forecast potential price corrections and continuations in the near term.
Fibonacci Analysis
An extensive evaluation of Cencora, Inc. (COR) shows a robust upward trend from March 2025 to November 2025. The stock's bullish movement is marked by a high of $374.75 on November 25, 2025, from a low of $224.68 on December 31, 2024. The analysis identifies key Fibonacci retracement levels that could provide insights into potential support and resistance zones.
| Metric | Value |
|---|---|
| Trend Start Date | 2024-12-31 |
| Trend End Date | 2025-11-25 |
| High Price Point | $374.75 (2025-11-25) |
| Low Price Point | $224.68 (2024-12-31) |
Calculated Fibonacci Levels:
| Level | Price |
|---|---|
| 0.236 | $285.87 |
| 0.382 | $312.47 |
| 0.500 | $324.71 |
| 0.618 | $336.95 |
| 0.786 | $356.53 |
The current price of $368.53 suggests it is within the 0.786 retracement level, indicating a potential area of resistance that might prompt a pullback or consolidate before further upward movement.
Technically, this suggests a potential reversal or continuation depending on how the price interacts with this level. Observing the volume and momentum indicators remains crucial for validation.
Conclusion
Cencora, Inc.'s stock demonstrates a strong recovery across the analyzed period, with the upward trend indicating bullish market sentiment. The identified Fibonacci levels provide critical insight for potential entry and exit points, specifically at the 0.786 level. While the stock has reached a significant resistance zone, the continuation of the trend depends on breaking this level with sustained volume. Risks involve possible market corrections; however, the underlying fundamentals and current momentum suggest growth potential. Analysts should keep an eye on economic indicators and company announcements that might impact price action, thereby offering strategic trading opportunities.