June 15, 2025 a 03:15 pm
COR: Fibonacci Analysis - Cencora, Inc.
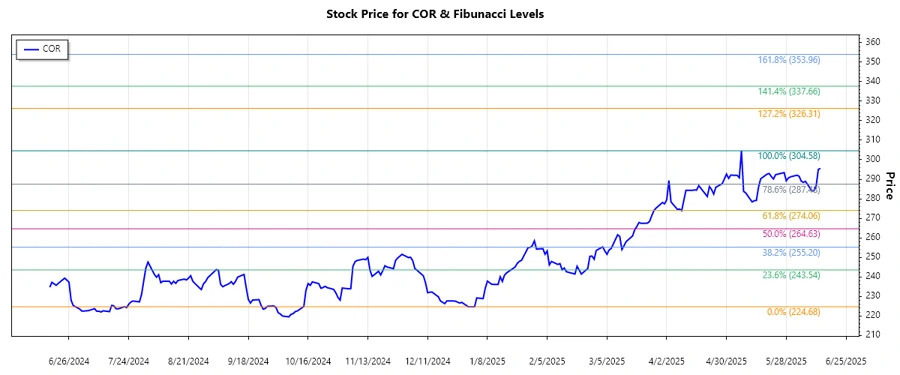
Cencora, Inc., previously known as AmerisourceBergen Corporation, is a leading entity in the pharmaceutical distribution sector. With a broad range of products and services across both U.S. and international markets, the stock presents intriguing opportunities for growth. However, its recent market performance depicted a downtrend after reaching a peak, requiring careful analysis of retracement levels for potential support or resistance points.
Fibonacci Analysis
| Period | Value |
|---|---|
| Start Date | 2024-12-02 |
| End Date | 2025-05-07 |
| High (Date) | 304.58 (2025-05-07) |
| Low (Date) | 224.68 (2024-12-31) |
Fibonacci Retracement Levels
| Level | Price |
|---|---|
| 0.236 | 281.99 |
| 0.382 | 271.85 |
| 0.5 | 264.63 |
| 0.618 | 257.42 |
| 0.786 | 247.28 |
The current price of 295.54 is above the 0.236 retracement level, indicating that the stock may yet find support at lower retracement levels. This suggests a strong resistance at the higher levels and potential limitations in current upward momentum.
Conclusion
Cencora, Inc.'s stock remains a robust option in the healthcare supply chain sector with its varied global operations. Recent price corrections indicate probable opportunities for strategic buying at key support levels identified through the Fibonacci analysis. However, resistance observed at higher retracement levels signals caution for aggressive entry positions. Analysts should remain vigilant to market conditions and company announcements, which may affect stock volatility. The technical analysis suggests monitoring the 0.236 and 0.382 levels for future price actions, given the current context.
Smart Data Insight
Master the Perfect Entry & Exit for this Stock
Don't leave your profits to chance. Historically, this stock follows specific seasonal patterns that institutional traders use to maximize returns.
- ✅ Identify the "Golden Buying Window"
- ✅ Avoid high-risk correction cycles
- ✅ Backtested data from the last 20+ years