EW: Fundamental Ratio Analysis - Edwards Lifesciences Corporation
EW: Evaluation of key financial ratios, analyst ratings, and price targets. A data-driven perspective on the valuation and market expectations.
May 27, 2026 a 06:00 pm
NVR: Analysts Ratings - NVR Inc
NVR: Comprehensive breakdown of current and historical analyst ratings, offering insights into how expert sentiment has evolved over time.
May 27, 2026 a 05:00 pm
MAS: Fibunacci Level Technical Analysis - Masco Corporation
MAS: Fibonacci retracement levels to identify key potential support and resistance zones, based on recent price trends.
May 27, 2026 a 04:44 pm
PNW: Analysts Ratings - Pinnacle West Capital Corporation
PNW: Comprehensive breakdown of current and historical analyst ratings, offering insights into how expert sentiment has evolved over time.
May 27, 2026 a 04:38 pm
UDR: Fundamental Ratio Analysis - UDR Inc
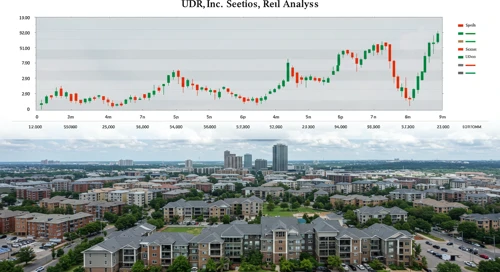
UDR: Evaluation of key financial ratios, analyst ratings, and price targets. A data-driven perspective on the valuation and market expectations.
May 27, 2026 a 03:43 pm
Consumer Cyclical Comparison. 27 May

Comparison of Consumer Cyclical. Where is strength and weakness? What has developed well and badly?
May 27, 2026 a 03:31 pm
NEE: Fibunacci Level Technical Analysis - NextEra Energy Inc
NEE: Fibonacci retracement levels to identify key potential support and resistance zones, based on recent price trends.
May 27, 2026 a 03:15 pm

JBHT: Analysts Ratings - JB Hunt Transport Services Inc
May 27, 2026 a 09:00 pm
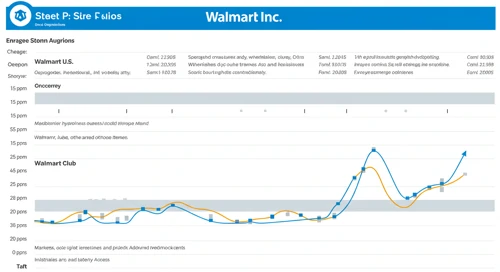
WMT: Analysts Ratings - Walmart Inc
May 27, 2026 a 08:38 pm

BIIB: Fundamental Ratio Analysis - Biogen Inc
May 27, 2026 a 07:43 pm

Todays Important Key Figures 27 May
May 27, 2026 a 07:00 pm
BKR: Trend with Support and Resistance Levels - Baker Hughes Company

BKR: Current price trend is evaluated alongside key support and resistance level. View of potential turning points and price momentum.
May 27, 2026 a 02:03 pm
LII: Trend with Support and Resistance Levels - Lennox International Inc
LII: Current price trend is evaluated alongside key support and resistance level. View of potential turning points and price momentum.
May 27, 2026 a 01:15 pm
WRB: Fundamental Ratio Analysis - W R Berkley Corporation
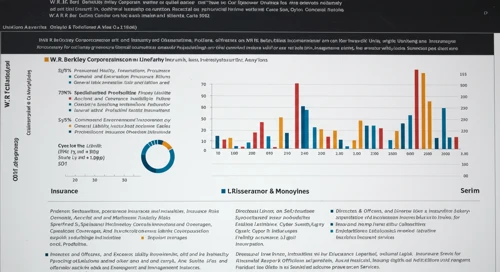
WRB: Evaluation of key financial ratios, analyst ratings, and price targets. A data-driven perspective on the valuation and market expectations.
May 27, 2026 a 01:00 pm
ALL: Analysts Ratings - The Allstate Corporation

ALL: Comprehensive breakdown of current and historical analyst ratings, offering insights into how expert sentiment has evolved over time.
May 27, 2026 a 01:00 pm
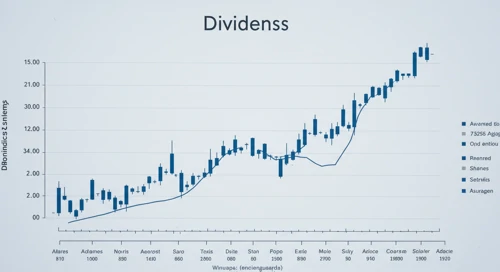
JPM: Dividend Analysis - JPMorgan Chase and Co

JPM: In-depth analysis of a company's dividend stability and key fundamental ratios to assess its financial strength and long-term investment potential.
May 27, 2026 a 12:46 pm
HWM: Analysts Ratings - Howmet Aerospace Inc

HWM: Comprehensive breakdown of current and historical analyst ratings, offering insights into how expert sentiment has evolved over time.
May 27, 2026 a 12:38 pm
Asia Comparison. 27 May

Comparison of Asia. Where is strength and weakness? What has developed well and badly?
May 27, 2026 a 12:31 pm
Stock Market - Heatmap
Use mouse wheel to zoom in and out. Click a ticker to display detailed information in a new window. Hover mouse cursor over a ticker to see more data.
Stock's
APA: Trend with Support and Resistance Levels - APA Corporation
APA: Current price trend is evaluated alongside key support and resistance level. View of potential turning points and price momentum.
May 27, 2026 a 09:03 am
OTIS: Analysts Ratings - Otis Worldwide Corporation
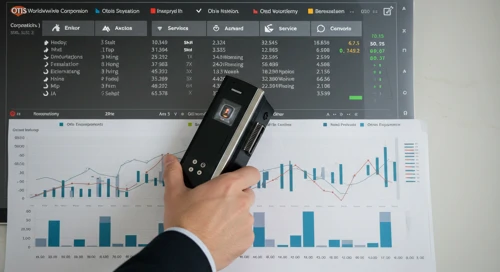
OTIS: Comprehensive breakdown of current and historical analyst ratings, offering insights into how expert sentiment has evolved over time.
May 27, 2026 a 09:00 am
EXE: Analysts Ratings - Expand Energy Corporation
EXE: Comprehensive breakdown of current and historical analyst ratings, offering insights into how expert sentiment has evolved over time.
May 27, 2026 a 08:38 am
BG: Fundamental Ratio Analysis - Bunge Global SA
BG: Evaluation of key financial ratios, analyst ratings, and price targets. A data-driven perspective on the valuation and market expectations.
May 27, 2026 a 08:00 am
CVNA: Fundamental Ratio Analysis - Carvana Co

CVNA: Evaluation of key financial ratios, analyst ratings, and price targets. A data-driven perspective on the valuation and market expectations.
May 27, 2026 a 07:43 am
DHI: Fibunacci Level Technical Analysis - DR Horton Inc
DHI: Fibonacci retracement levels to identify key potential support and resistance zones, based on recent price trends.
May 27, 2026 a 06:44 am
AAPL: Fibunacci Level Technical Analysis - Apple Inc
AAPL: Fibonacci retracement levels to identify key potential support and resistance zones, based on recent price trends.
May 27, 2026 a 05:15 am
DVN: Fibunacci Level Technical Analysis - Devon Energy Corporation
May 27, 2026 a 11:44 am

BLDR: Fundamental Ratio Analysis - Builders FirstSource Inc
May 27, 2026 a 11:43 am
TECH: Dividend Analysis - Bio Techne Corporation
May 27, 2026 a 11:31 am
TROW: Fibunacci Level Technical Analysis - T Rowe Price Group Inc
May 27, 2026 a 10:15 am
CPRT: Trend with Support and Resistance Levels - Copart Inc
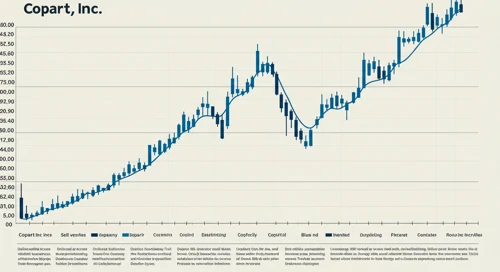
CPRT: Current price trend is evaluated alongside key support and resistance level. View of potential turning points and price momentum.
May 27, 2026 a 04:03 am
ETN: Dividend Analysis - Eaton Corporation plc
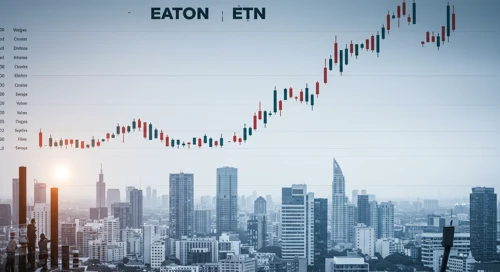
ETN: In-depth analysis of a company's dividend stability and key fundamental ratios to assess its financial strength and long-term investment potential.
May 27, 2026 a 03:31 am
IBKR: Trend with Support and Resistance Levels - Interactive Brokers Group Inc
IBKR: Current price trend is evaluated alongside key support and resistance level. View of potential turning points and price momentum.
May 27, 2026 a 03:15 am
TJX: Dividend Analysis - The TJX Companies Inc

TJX: In-depth analysis of a company's dividend stability and key fundamental ratios to assess its financial strength and long-term investment potential.
May 27, 2026 a 02:46 am
EPAM: Analysts Ratings - EPAM Systems Inc

EPAM: Comprehensive breakdown of current and historical analyst ratings, offering insights into how expert sentiment has evolved over time.
May 26, 2026 a 09:00 pm
NDAQ: Analysts Ratings - Nasdaq Inc

NDAQ: Comprehensive breakdown of current and historical analyst ratings, offering insights into how expert sentiment has evolved over time.
May 26, 2026 a 08:38 pm
AFL: Fundamental Ratio Analysis - Aflac Incorporated
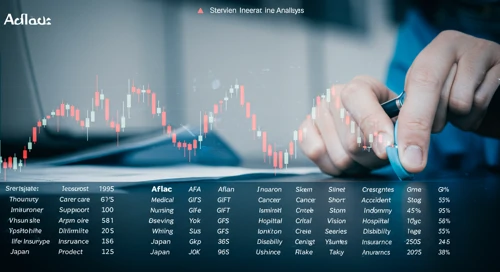
AFL: Evaluation of key financial ratios, analyst ratings, and price targets. A data-driven perspective on the valuation and market expectations.
May 26, 2026 a 07:43 pm
Economic Calendar
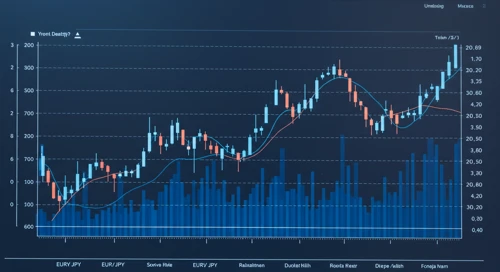
Currencies
EURGBP: Trend with Support and Resistance Levels
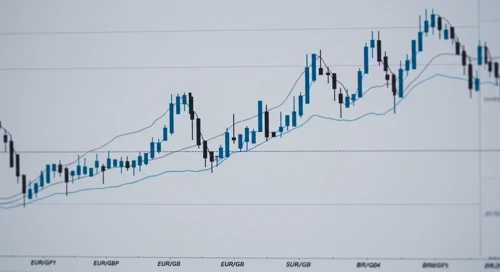
EURGBP: Current price trend is evaluated alongside key support and resistance level. View of potential turning points and price momentum.
May 26, 2026 a 04:28 am
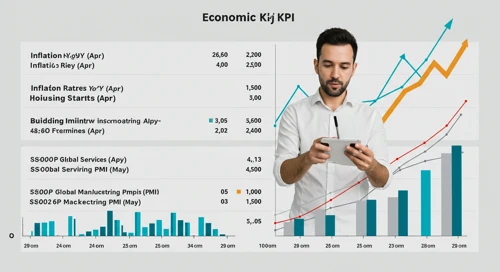
Important Key Figures of the last Days

Overview of key economic indicators released over the past days, highlighting their potential impact on markets and investor sentiment.
May 26, 2026 a 02:31 am
Todays Important Key Figures 25 May

Today’s important economic data releases – a snapshot of key indicators influencing markets and shaping financial expectations.
May 25, 2026 a 07:00 pm
GBPUSD: Fibunacci Level Technical Analysis
GBPUSD: Fibonacci retracement levels to identify key potential support and resistance zones, based on recent price trends.
May 25, 2026 a 05:08 am
GBPJPY: Trend with Support and Resistance Levels
GBPJPY: Current price trend is evaluated alongside key support and resistance level. View of potential turning points and price momentum.
May 25, 2026 a 04:28 am
GBPCAD: Fibunacci Level Technical Analysis
GBPCAD: Fibonacci retracement levels to identify key potential support and resistance zones, based on recent price trends.
May 24, 2026 a 05:08 am
NZDCAD: Trend with Support and Resistance Levels
NZDCAD: Current price trend is evaluated alongside key support and resistance level. View of potential turning points and price momentum.
May 24, 2026 a 04:28 am
GBPAUD: Fibunacci Level Technical Analysis
May 27, 2026 a 05:08 am
EURJPY: Trend with Support and Resistance Levels
May 27, 2026 a 04:28 am

Todays Important Key Figures 26 May
May 26, 2026 a 07:00 pm
CADJPY: Fibunacci Level Technical Analysis
May 26, 2026 a 05:08 am
AUDNZD: Fibunacci Level Technical Analysis
AUDNZD: Fibonacci retracement levels to identify key potential support and resistance zones, based on recent price trends.
May 23, 2026 a 05:08 am
Todays Important Key Figures 23 May

Today’s important economic data releases – a snapshot of key indicators influencing markets and shaping financial expectations.
May 22, 2026 a 11:00 pm
Todays Important Key Figures 22 May

Today’s important economic data releases – a snapshot of key indicators influencing markets and shaping financial expectations.
May 22, 2026 a 07:00 pm
USDJPY: Fibunacci Level Technical Analysis
USDJPY: Fibonacci retracement levels to identify key potential support and resistance zones, based on recent price trends.
May 22, 2026 a 05:08 am
AUDCAD: Trend with Support and Resistance Levels
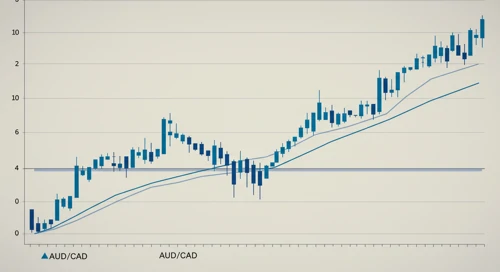
AUDCAD: Current price trend is evaluated alongside key support and resistance level. View of potential turning points and price momentum.
May 22, 2026 a 04:28 am
Todays Important Key Figures 21 May
Today’s important economic data releases – a snapshot of key indicators influencing markets and shaping financial expectations.
May 21, 2026 a 07:00 pm
EURAUD: Fibunacci Level Technical Analysis
EURAUD: Fibonacci retracement levels to identify key potential support and resistance zones, based on recent price trends.
May 21, 2026 a 05:08 am
Currencies