April 15, 2026 a 02:46 am

COR: Dividend Analysis - Cencora, Inc.
Cencora, Inc. presents a promising profile with a solid history of dividend payments over the past 26 years. Although the current dividend yield is modest, the company's consistent dividend growth reflects a commitment to returning value to shareholders. The company’s current strategy of managing its payout ratios positions it well for long-term stability and growth.
📊 Overview
Cencora, Inc. operates in a sector that requires a balanced approach to dividends to maintain market competitiveness and shareholder satisfaction. With a dividend yield of 0.64%, the company offers stability, demonstrated by 26 years of uninterrupted dividend history, and no recent cuts.
| Metric | Value |
|---|---|
| Sector | Healthcare |
| Dividend yield | 0.64 % |
| Current dividend per share | 2.26 USD |
| Dividend history | 26 years |
| Last cut or suspension | None |
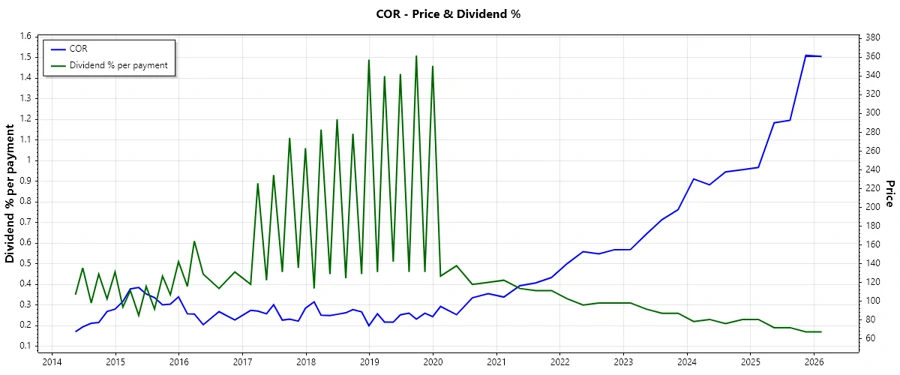
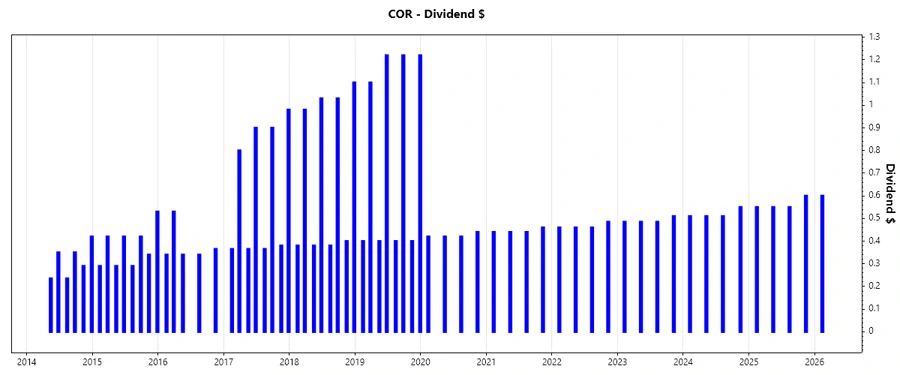
📈 Dividend History
Cencora's dividend history showcases its robust financial health. The consistency in payments underscores the company's ability to generate sustainable cash flows, making it a reliable source of income for its investors.
| Year | Dividend per Share (USD) |
|---|---|
| 2026 | 0.60 |
| 2025 | 2.25 |
| 2024 | 2.08 |
| 2023 | 1.97 |
| 2022 | 1.87 |
📈 Dividend Growth
The steady dividend growth over the past 3 and 5 years suggests that Cencora, Inc. maintains a healthy and sustainable approach to increasing shareholder value. This is a critical factor for investors looking for long-term capital appreciation.
| Time | Growth |
|---|---|
| 3 years | 6.46 % |
| 5 years | 5.77 % |
The average dividend growth is 5.77 % over 5 years. This shows moderate but steady dividend growth.
📊 Payout Ratio
Understanding payout ratios is crucial as they indicate the portion of earnings paid to shareholders. Cencora's payout ratios reveal disciplined financial management.
| Key figure | Ratio |
|---|---|
| EPS-based | 26.95 % |
| Free cash flow-based | 12.16 % |
With an EPS payout ratio of 26.95 % and a free cash flow payout of 12.16 %, Cencora effectively balances shareholder returns with business reinvestment needs.
🔍 Cashflow & Capital Efficiency
The analysis of cashflow and capital efficiency highlights the company's ability to generate operational cash and fund growth. Cencora's strong free cash flow yield and relationship between CAPEX and Operating Cash Flow emphasize strategic reinvestment capabilities.
| Metric | 2025 | 2024 | 2023 |
|---|---|---|---|
| Free Cash Flow Yield | 5.29 % | 6.71 % | 9.38 % |
| Earnings Yield | 2.57 % | 3.38 % | 4.74 % |
| CAPEX to Operating Cash Flow | 15.89 % | 13.98 % | 11.72 % |
| Stock-based Compensation to Revenue | 0 % | 0.05 % | 0.05 % |
| Free Cash Flow / Operating Cash Flow Ratio | 82.76 % | 86.02 % | 88.28 % |
The metrics demonstrate Cencora's robust cash flow management and efficiency in capital deployment, indicating sound financial health.
🔍 Balance Sheet & Leverage Analysis
A prudent leverage structure and strong balance sheet position Cencora as a financially stable entity. It reflects its capability to meet long-term obligations while maintaining growth.
| Metric | 2025 | 2024 | 2023 |
|---|---|---|---|
| Debt-to-Equity | 7.13 | 10.30 | 13.06 |
| Debt-to-Assets | 14.03 % | 9.91 % | 10.90 % |
| Debt-to-Capital | 87.70 % | 91.15 % | 92.89 % |
| Net Debt to EBITDA | 1.70 | 1.02 | 1.21 |
| Current Ratio | 0.90 | 0.88 | 0.88 |
| Quick Ratio | 0.55 | 0.53 | 0.52 |
| Financial Leverage | 50.79 | 103.88 | 119.84 |
Despite a high leverage ratio, the company's efficient capitalization strategy maintains a manageable debt load, ensuring financial resilience.
🔍 Fundamental Strength & Profitability
Evaluation of fundamental strength and profitability sheds light on Cencora's operational efficiency and margin profile, key indicators of its financial prowess.
| Metric | 2025 | 2024 | 2023 |
|---|---|---|---|
| Return on Equity | 103.06 % | 233.63 % | 334.35 % |
| Return on Assets | 2.03 % | 2.25 % | 2.79 % |
| Margins: Net | 0.48 % | 0.51 % | 0.67 % |
| EBIT | 0.83 % | 0.77 % | 0.93 % |
| EBITDA | 1.16 % | 1.14 % | 1.30 % |
| Gross | 3.16 % | 2.96 % | 2.96 % |
| R&D to Revenue | 0 % | 0 % | 0 % |
The high return on equity and stable margins reflect Cencora's efficient use of its assets to generate profits.
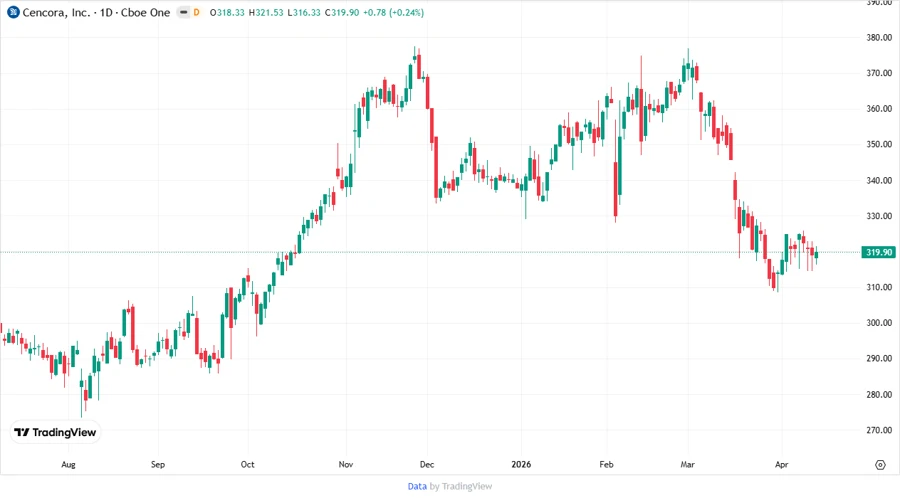
📈 Price Development
🌟 Dividend Scoring System
| Criteria | Score | |
|---|---|---|
| Dividend yield | 3 | |
| Dividend Stability | 5 | |
| Dividend growth | 4 | |
| Payout ratio | 5 | |
| Financial stability | 4 | |
| Dividend continuity | 5 | |
| Cashflow Coverage | 4 | |
| Balance Sheet Quality | 3 |
Total Score: 33/40
🏆 Rating
Cencora, Inc. demonstrates a strong commitment to dividend growth and stability, making it an attractive option for investors seeking reliable income. The combination of sound financial management and progressive dividend policies underpins a high rating in the current economic context.
Smart Data Insight
Master the Perfect Entry & Exit for this Stock
Don't leave your profits to chance. Historically, this stock follows specific seasonal patterns that institutional traders use to maximize returns.
- ✅ Identify the "Golden Buying Window"
- ✅ Avoid high-risk correction cycles
- ✅ Backtested data from the last 20+ years