February 19, 2026 a 12:46 pm

COR: Dividend Analysis - Cencora, Inc.
Cencora, Inc. demonstrates a consistent dividend history with 26 years of uninterrupted dividends. The company has maintained its dividend payouts effectively, suggesting a stable approach to investor returns. While the dividend yield is relatively modest, the firm’s commitment to moderate growth over the past years reflects strong financial management.
📊 Overview
The following table provides a comprehensive snapshot of Cencora, Inc.'s dividend metrics.
| Sector | Dividend Yield | Current Dividend per Share | Dividend History | Last Cut or Suspension |
|---|---|---|---|---|
| Health Care | 0.64% | 2.26 USD | 26 years | None |
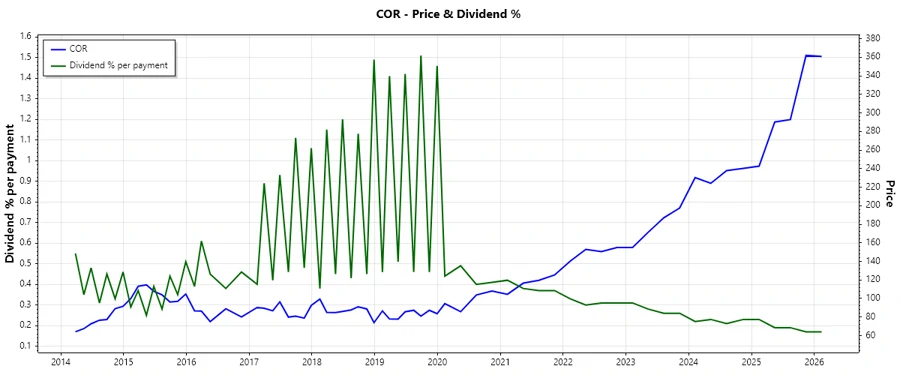
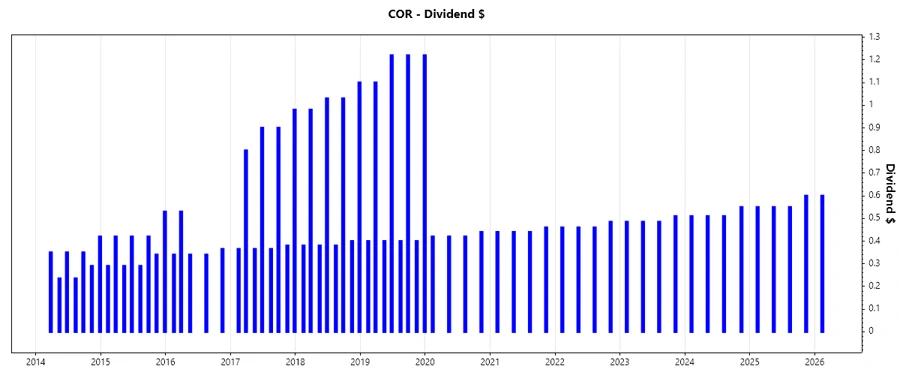
📈 Dividend History
Cencora, Inc.'s 26-year dividend history is a testament to its stability and reliability in delivering shareholder value. The consistent payment of dividends can help buffer against market volatility and provide steady income.
| Year | Dividend per Share |
|---|---|
| 2026 | 0.60 |
| 2025 | 2.25 |
| 2024 | 2.08 |
| 2023 | 1.965 |
| 2022 | 1.865 |
📉 Dividend Growth
Dividend growth indicates the company's potential to increase payouts over time, protecting investors against inflation. Cencora, Inc. displays a stable growth trajectory over the past three and five years.
| Time | Growth |
|---|---|
| 3 years | 6.46% |
| 5 years | 5.77% |
The average dividend growth is 5.77% over 5 years. This shows moderate but steady dividend growth.
⚖️ Payout Ratio
Payout ratios are key to evaluating a company's sustainability of dividends. A balance between dividends paid and company earnings or cash flow is crucial.
| Key Figure | Ratio |
|---|---|
| EPS-based | 26.95% |
| Free cash flow-based | 12.16% |
The EPS-based payout ratio of 26.95% suggests a solid coverage by earnings, while the lower FCF-based ratio of 12.16% indicates excellent liquidity, allowing Cencora, Inc. to sustain its dividends even during earnings fluctuations.
💵 Cashflow & Capital Efficiency
Robust free cash flow and capital efficiency are vital indicators of a company's ability to generate the cash necessary to cover dividends without compromising growth funding.
| Metric | 2025 | 2024 | 2023 |
|---|---|---|---|
| Free Cash Flow Yield | 5.29% | 6.71% | 9.38% |
| Earnings Yield | 2.57% | 3.38% | 4.74% |
| CAPEX to Operating Cash Flow | 17.24% | 13.98% | 11.72% |
| Stock-based Compensation to Revenue | 0.04% | 0.05% | 0.05% |
| Free Cash Flow / Operating Cash Flow Ratio | 82.76% | 86.02% | 88.28% |
The data suggests stable cash flows and efficient capital allocation, highlighting Cencora's ability to support dividends while undertaking reinvestment for growth.
📊 Balance Sheet & Leverage Analysis
A strong balance sheet underpins a company's long-term financial health, reducing risks associated with debt servicing.
| Metric | 2025 | 2024 | 2023 |
|---|---|---|---|
| Debt-to-Equity | 7.13 | 10.30 | 13.06 |
| Debt-to-Assets | 14.03% | 9.91% | 10.90% |
| Debt-to-Capital | 87.70% | 91.15% | 92.89% |
| Net Debt to EBITDA | 1.70 | 1.02 | 1.21 |
| Current Ratio | 0.90 | 0.88 | 0.88 |
| Quick Ratio | 0.55 | 0.53 | 0.52 |
| Financial Leverage | 50.79 | 103.88 | 119.84 |
The high debt ratios indicate significant leverage, suggesting a careful assessment of debt servicing capabilities. Improvements in liquidity ratios will be beneficial.
📊 Fundamental Strength & Profitability
Profitability metrics are indicators of the efficiency by which the company converts investment into profit, offering insight into dividend sustainability.
| Metric | 2025 | 2024 | 2023 |
|---|---|---|---|
| Return on Equity | 1.03% | 2.34% | 3.34% |
| Return on Assets | 0.20% | 0.22% | 0.28% |
| Return on Invested Capital | 13.23% | 16.94% | 13.48% |
| Net Margin | 0.48% | 0.51% | 0.67% |
| EBIT Margin | 0.83% | 0.77% | 0.93% |
| EBITDA Margin | 1.16% | 1.14% | 1.30% |
| Gross Margin | 3.16% | 2.96% | 2.96% |
Strengthening margins and growth in ROE indicate underlying profitability enhancements, improving dividend viability.
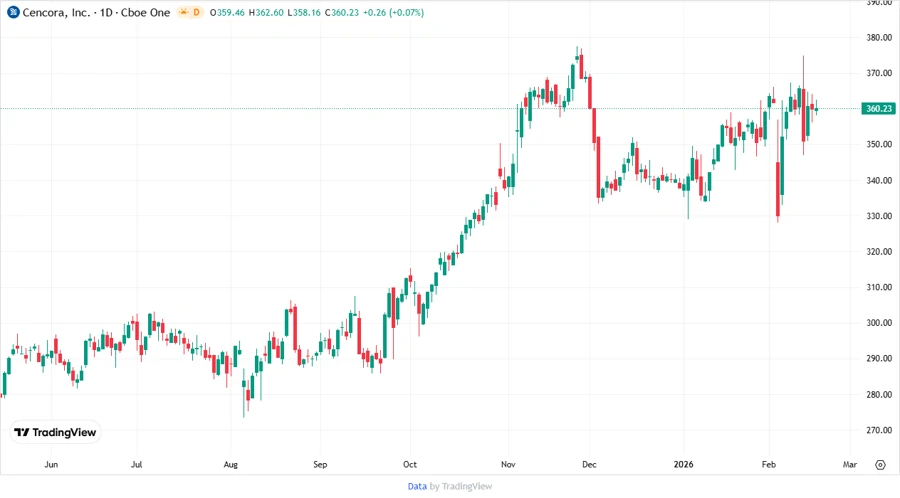
💹 Price Development
✅ Dividend Scoring System
The Cencora, Inc. dividend scoring system evaluates key categories based on recent performance and moderation factors.
| Criteria | Score | Score Bar |
|---|---|---|
| Dividend yield | 2 | |
| Dividend Stability | 5 | |
| Dividend growth | 4 | |
| Payout ratio | 5 | |
| Financial stability | 3 | |
| Dividend continuity | 5 | |
| Cashflow Coverage | 5 | |
| Balance Sheet Quality | 3 |
Total Score: 32/40
🗣️ Rating
Cencora, Inc. presents itself as a robust option for income-focused investors, despite a relatively low dividend yield. The strong dividend history and moderate growth paired with efficient cash flow management highlight its potential. However, one must prudently consider the leverage levels outlined in financial ratios. Overall, Cencora, Inc. is a commendable choice for those seeking stable, albeit moderated, yields.
Smart Data Insight
Master the Perfect Entry & Exit for this Stock
Don't leave your profits to chance. Historically, this stock follows specific seasonal patterns that institutional traders use to maximize returns.
- ✅ Identify the "Golden Buying Window"
- ✅ Avoid high-risk correction cycles
- ✅ Backtested data from the last 20+ years