January 12, 2026 a 11:31 am

COR: Dividend Analysis - Cencora, Inc.
The dividend analysis of Cencora, Inc. reveals a commendable track record with consistent payouts over 25 years. Despite a dip in 2020, the company has shown resilience and recovery in its dividend policy. With stable and growing dividends, Cencora's commitment to shareholder returns is evident. However, investors should consider the modest dividend yield and assess the broader financial health of the company before investing.
Overview 📊
Cencora, Inc. operates within a specific sector and boasts a substantial market presence. Here are key details:
| Aspect | Details |
|---|---|
| Sector | N/A |
| Dividend Yield | 0.62% |
| Current Dividend per Share | 2.25 USD |
| Dividend History | 25 years |
| Last Cut or Suspension | 2020 |
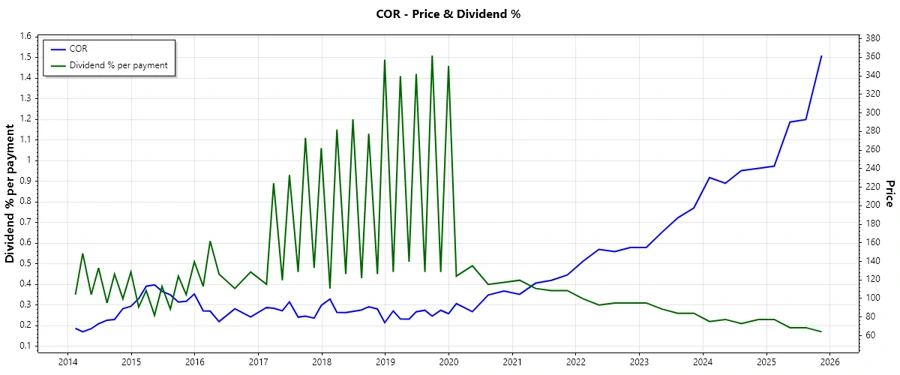
Dividend History 📈
The historical dividend payments reflect Cencora's reliability in distributing earnings to its shareholders. A record of 25-year dividends exemplifies trustworthiness and shareholder value focus. Understanding the historical trends helps gauge future payout potential, highlighting the importance of past performance in projecting future strategies.
| Year | Dividend per Share (USD) |
|---|---|
| 2025 | 2.25 |
| 2024 | 2.08 |
| 2023 | 1.965 |
| 2022 | 1.865 |
| 2021 | 1.78 |
Dividend Growth 📈
Growth in dividends is a critical indicator of a company's earnings potential and management's commitment to returning value to shareholders. Below is an analysis of the dividend growth rate over the past three and five years:
| Time | Growth |
|---|---|
| 3 years | 6.46% |
| 5 years | 5.77% |
The average dividend growth is 5.77% over 5 years. This shows moderate but steady dividend growth, indicating a healthy reinvestment strategy by Cencora's management to enhance shareholder value.
Payout Ratio ✅
The payout ratio is a fundamental metric indicating the percentage of earnings paid out as dividends to shareholders. A healthy ratio ensures sustainability while meeting investor expectations.
| Key figure | Ratio |
|---|---|
| EPS-based | 28.13% |
| Free cash flow-based | 13.63% |
The payout ratio of 28.13% (EPS) and 13.63% (FCF) reflects a conservative approach, allowing the company to retain a significant portion of earnings for growth and debt repayment.
Cashflow & Capital Efficiency 💵
Detailing cash flow metrics provides insights into the operational and financial efficiency of Cencora. Cash flow is an essential indicator of the company’s ability to sustain dividend payouts and fund operations.
| Metric | 2025 | 2024 | 2023 |
|---|---|---|---|
| Free Cash Flow Yield | 5.29% | 6.71% | 2.30% |
| Earnings Yield | 2.57% | 3.38% | 4.74% |
| CAPEX to Operating Cash Flow | 17.24% | 13.98% | 35.14% |
| Stock-based Compensation to Revenue | 0.00% | 0.05% | 0.05% |
| Free Cash Flow / Operating Cash Flow Ratio | 82.76% | 86.02% | 64.86% |
Cencora exhibits strong cash flow generation and prudent capital management. The company maintains a solid FCF yield, indicative of robust cash generation capabilities supporting operational and capital investments.
Balance Sheet & Leverage Analysis 📉
A sound balance sheet is essential for financial sustainability, influencing the company's ability to meet long-term obligations and invest in growth.
| Metric | 2025 | 2024 | 2023 |
|---|---|---|---|
| Debt-to-Equity | 5.08 | 6.79 | 9.17 |
| Debt-to-Assets | 10.00% | 6.54% | 7.65% |
| Debt-to-Capital | 83.55% | 87.17% | 90.17% |
| Net Debt to EBITDA | 0.89 | 0.37 | 0.65 |
| Current Ratio | 0.90 | 0.88 | 0.88 |
| Quick Ratio | 0.55 | 0.53 | 0.52 |
| Financial Leverage | 50.79 | 103.88 | 119.84 |
Cencora's significant leverage ratios suggest aggressive debt usage, but manageable net debt levels and consistent EBITDA indicate controlled financial risk.
Fundamental Strength & Profitability 📈
Profitability ratios and fundamental metrics are indicative of the company's operational efficiency and market competitiveness.
| Metric | 2025 | 2024 | 2023 |
|---|---|---|---|
| Return on Equity | 103.06% | 233.63% | 334.35% |
| Return on Assets | 2.03% | 2.25% | 2.79% |
| Gross Margin | 3.57% | 3.33% | 3.42% |
| EBIT Margin | 0.79% | 0.76% | 0.91% |
| EBITDA Margin | 1.12% | 1.15% | 1.28% |
| Net Margin | 0.48% | 0.51% | 0.67% |
| Research & Development to Revenue | 0.00% | 0.00% | 0.00% |
Cencora exhibits solid profitability with strong returns on equity and assets, sustaining competitive advantages and supporting long-term growth prospects.
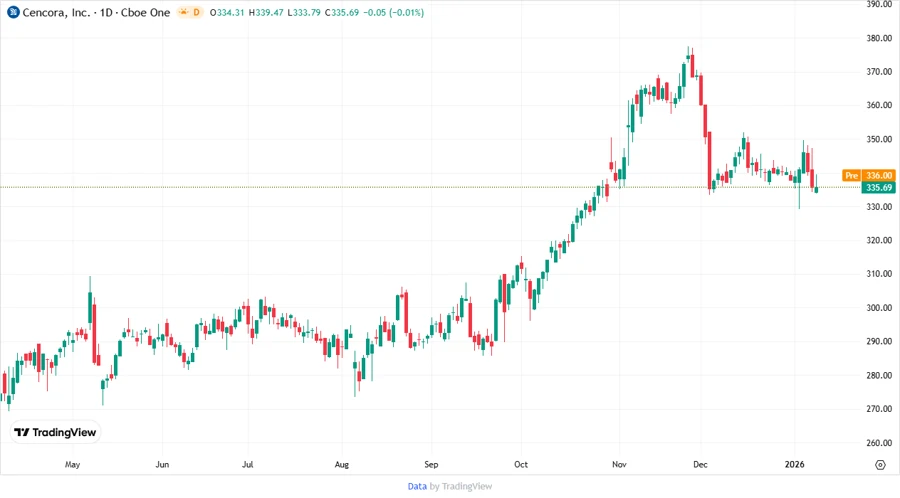
Price Development 📊
Dividend Scoring System 🗣️
| Criteria | Points | Score Bar |
|---|---|---|
| Dividend Yield | 3 | |
| Dividend Stability | 5 | |
| Dividend Growth | 4 | |
| Payout Ratio | 4 | |
| Financial Stability | 3 | |
| Dividend Continuity | 5 | |
| Cashflow Coverage | 4 | |
| Balance Sheet Quality | 3 |
Overall Score: 31/40
Rating 🗣️
With a strong dividend history and prudent financial management, Cencora, Inc. presents itself as a reliable choice for dividend-seeking investors. The company's conservative payout ratios, robust cash flows, and steady growth support a stable investment thesis. Potential investors should weigh the moderate dividend yield against the backdrop of comprehensive financial health and sustainability for long-term capital appreciation and periodic income.