August 06, 2025 a 03:31 pm


COR: Dividend Analysis - Cencora, Inc.
🔍 Cencora, Inc. presents a robust dividend profile with significant historical stability. The company's commitment to maintaining its dividend payments over a quarter-century is commendable. Investors need to be aware of the recent levels of dividend growth, which suggest cautious future prospects.
📊 Overview
Cencora, Inc., operating within the healthcare sector, reflects a current dividend yield of 0.74%, paired with a current dividend per share of $2.10. Notably, the company boasts an impressive 25-year history of consistent dividend payments, with no recent cuts or suspensions. This positioning underscores its resilience in dividend distribution over time.
| Attribute | Value |
|---|---|
| Sector | Healthcare |
| Dividend Yield | 0.74% |
| Current Dividend Per Share | $2.10 USD |
| Dividend History | 25 years |
| Last Cut or Suspension | None |
🗣️ Dividend History
A deep dive into Cencora's dividend history reveals consistent payouts to shareholders, anchoring investor confidence. The company's ability to sustain dividends even in tougher financial climates is crucial for long-term investment strategies.
| Year | Dividend Per Share (USD) |
|---|---|
| 2025 | 1.10 |
| 2024 | 2.08 |
| 2023 | 1.965 |
| 2022 | 1.865 |
| 2021 | 1.78 |
📈 Dividend Growth
The analysis of dividend growth over the past three and five years indicates modest development. This data provides insight into the company's future capacity for increasing shareholder returns.
| Time | Growth |
|---|---|
| 3 years | 0.05% |
| 5 years | -0.20% |
The average dividend growth is -0.20% over 5 years. This shows moderate but steady dividend growth.
🗳️ Payout Ratio
Cencora's payout ratios reflect its dividend sustaining capabilities and implication for reinvestment.
| Key Figure | Ratio |
|---|---|
| EPS-based | 21.41% |
| Free Cash Flow-based | 35.60% |
The payout ratios, notably 21.41% (EPS) and 35.60% (FCF), demonstrate a balanced approach towards maintaining dividends while being strategic about reinvestment and growth sustainable measures.
🏦 Cashflow & Capital Efficiency
Evaluating Cencora's cashflow situation is fundamental to gauge its long-term sustainability and investment in growth opportunities.
| Metric | 2024 | 2023 | 2022 |
|---|---|---|---|
| Free Cash Flow Yield | 6.71% | 9.47% | 7.82% |
| Earnings Yield | 3.38% | 4.79% | 6.02% |
| CAPEX to Operating Cash Flow | 34.47% | 11.72% | 18.36% |
| Stock-based Compensation to Revenue | 0.05% | 0.048% | 0.039% |
| Free Cash Flow / Operating Cash Flow Ratio | 86.02% | 88.28% | 81.64% |
The data highlights Cencora's effective utilization of cash flows and capital return efficiency, a critical indicator for sustaining operational and investment activities over the long run.
🧾 Balance Sheet & Leverage Analysis
Cencora's balance sheet metrics are pivotal in assessing its financial health and leverage utilization.
| Metric | 2024 | 2023 | 2022 |
|---|---|---|---|
| Debt-to-Equity | 6.79 | 7.18 | -19.68 |
| Debt-to-Assets | 6.53% | 7.65% | 10.08% |
| Debt-to-Capital | 87.16% | 87.78% | 105.35% |
| Net Debt to EBITDA | 0.37 | 0.64 | 0.74 |
| Current Ratio | 0.88 | 0.88 | 0.91 |
| Quick Ratio | 0.53 | 0.52 | 0.55 |
| Financial Leverage | 103.88 | 93.89 | -195.18 |
The leverage ratios suggest that Cencora's use of debt is diverse but carefully managed to maximize its business model's fluidity while retaining overall financial resilience.
📊 Fundamental Strength & Profitability
Analyzing profitability metrics is critical in understanding how well the company converts revenues into profits.
| Metric | 2024 | 2023 | 2022 |
|---|---|---|---|
| Return on Equity | 2.34% | 2.62% | -5.86% |
| Return on Assets | 2.25% | 2.79% | 3.00% |
| Margins: Net | 0.51% | 0.67% | 0.71% |
| Margins: EBIT | 0.77% | 0.93% | 1.01% |
| Margins: EBITDA | 1.15% | 1.30% | 1.30% |
| Margins: Gross | 3.37% | 3.42% | 3.49% |
| R&D to Revenue | 0% | 0% | 0% |
Cencora's advantage lies in its ability to maintain profitability while leveraging minimal R&D expenditure, suggesting an efficient cost management approach.
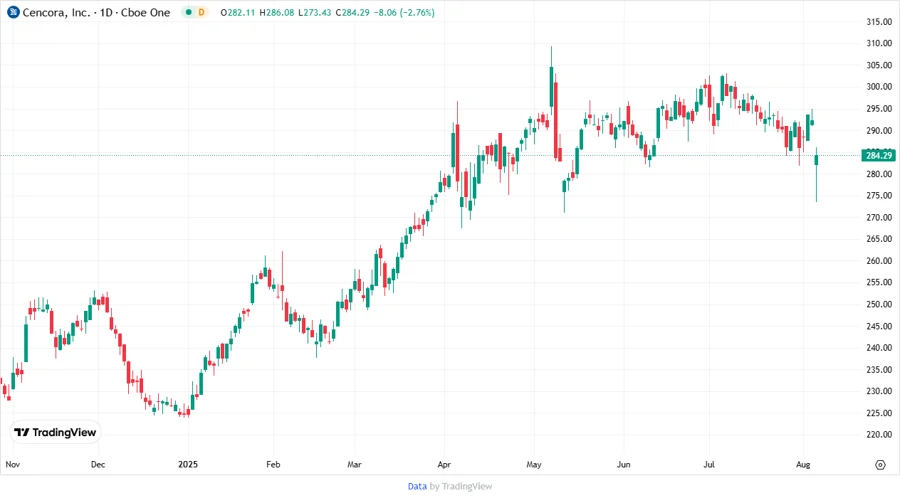
🏛️ Price Development
🔍 Dividend Scoring System
| Criteria | Score | |
|---|---|---|
| Dividend yield | 2 | |
| Dividend Stability | 4 | |
| Dividend growth | 2 | |
| Payout ratio | 3 | |
| Financial stability | 3 | |
| Dividend continuity | 5 | |
| Cashflow Coverage | 4 | |
| Balance Sheet Quality | 3 |
Total Score: 26/40
✅ Rating
In conclusion, Cencora, Inc.'s dividend profile is highlighted by its stability but tempered by moderate growth prospects. The solid payout ratios and careful debt management strategies offer a foundation for continuity. Investors favoring stable dividend stocks could find Cencora an appealing long-term target, though those seeking robust growth might consider diversifying.
Smart Data Insight
Master the Perfect Entry & Exit for this Stock
Don't leave your profits to chance. Historically, this stock follows specific seasonal patterns that institutional traders use to maximize returns.
- ✅ Identify the "Golden Buying Window"
- ✅ Avoid high-risk correction cycles
- ✅ Backtested data from the last 20+ years