March 06, 2026 a 03:15 am
COP: Trend and Support & Resistance Analysis - ConocoPhillips
ConocoPhillips (COP) has shown a varied performance over the past months, reflecting fluctuations in the broader energy market. With operations spanning various global regions and involvement in conventional and unconventional oil and gas projects, COP exhibits resilience amid market dynamics. Technical indicators suggest recent upward momentum, requiring close monitoring as the company navigates an evolving energy landscape.
Trend Analysis
| Date | Close Price | Trend |
|---|---|---|
| 2026-03-05 | 116.82 | ▲ Up |
| 2026-03-04 | 115.65 | ▲ Up |
| 2026-03-03 | 118.52 | ▲ Up |
| 2026-03-02 | 118.24 | ▲ Up |
| 2026-02-27 | 113.46 | ▲ Up |
| 2026-02-26 | 110.70 | ▲ Up |
| 2026-02-25 | 110.01 | ▲ Up |
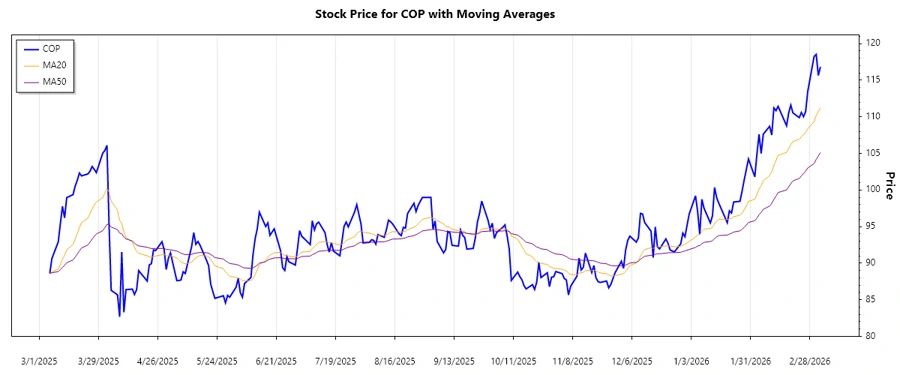
The trend analysis based on the most recent data shows an upward movement, as the EMA20 is greater than the EMA50. This indicates a continued positive sentiment and potential growth in stock value.
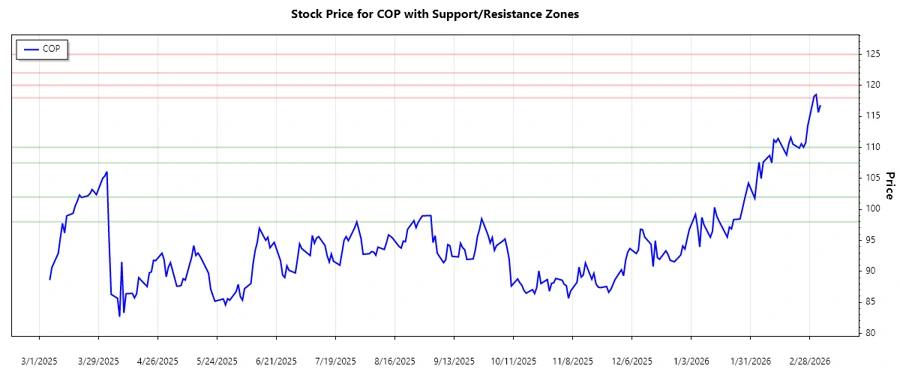
Support and Resistance
| Zone | From | To |
|---|---|---|
| Support Zone 1 | 107.50 | 110.00 |
| Support Zone 2 | 98.00 | 102.00 |
| Resistance Zone 1 | 118.00 | 120.00 |
| Resistance Zone 2 | 122.00 | 125.00 |
Currently, the stock price is close to surpassing the first resistance zone, indicating potential upward momentum if the stock breaks beyond this level.
Conclusion
ConocoPhillips demonstrates a resilient upward trend, with key support zones establishing a strong base against potential downturns. The close proximity to resistance zones suggests potential for further gains if the stock breaks through these levels. Investors should be cognizant of market dynamics and broader geopolitical factors influencing the energy sector. While positive technical indicators present growth prospects, they should be balanced against macroeconomic uncertainties.