July 21, 2025 a 11:44 am

COP: Fibonacci Analysis - ConocoPhillips
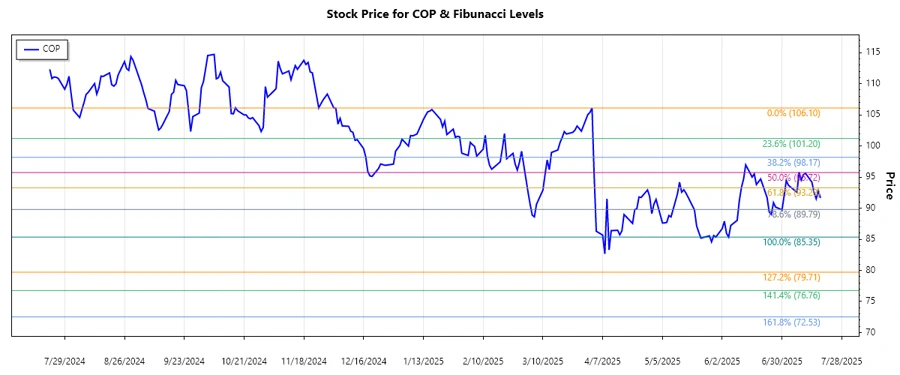
ConocoPhillips, an energy sector giant, has been showing fluctuating trends over the past few months with notable shifts in its price levels. The recent market behavior indicates potential volatility due to external economic factors. Evaluating the support and resistance levels can provide insight into future price movements and help in making informed investment decisions.
Fibonacci Analysis
| Aspect | Detail |
|---|---|
| Trend Start Date | 2025-07-18 |
| Trend End Date | 2025-04-02 |
| High Price Point | $106.10 (2025-04-02) |
| Low Price Point | $85.35 (2025-06-05) |
| Current Price | $91.64 (2025-07-18) |
| Fibonacci Levels |
|
| Retracement Zone | 0.236 - Current price is around this level indicating minor support. |
| Technical Interpretation | The current price level near the 0.236 retracement might serve as a support, suggesting a potential bounce back in price if market conditions turn favorable. |
Conclusion
The recent trend analysis of ConocoPhillips suggests a bearish movement with potential support around the 0.236 Fibonacci level. Investors should be cautious as the market is influenced by external economic conditions. A breach below this threshold could lead to further declines, while stabilization may indicate consolidation. Analysts should closely watch for changes in oil prices and geopolitical events, as these could impact the stock's volatility and future price trajectory.
Smart Data Insight
Master the Perfect Entry & Exit for this Stock
Don't leave your profits to chance. Historically, this stock follows specific seasonal patterns that institutional traders use to maximize returns.
- ✅ Identify the "Golden Buying Window"
- ✅ Avoid high-risk correction cycles
- ✅ Backtested data from the last 20+ years