
July 05, 2026 a 12:46 pm
COP: Dividend Analysis - ConocoPhillips
ConocoPhillips, with its long dividend history of 45 years, presents a stable investment case. However, slight concerns arise due to recent negative dividend growth over the past three years. Its payout ratios indicate a moderate level of distribution to shareholders, ensuring the potential for sustainable future growth. The company's balance sheet and leverage ratios suggest financial stability, supporting its dividend sustainability.
📊 Overview
| Metric | Details |
|---|---|
| Sector | Energy |
| Dividend Yield | 2.86% |
| Current Dividend Per Share | 3.19 USD |
| Dividend History | 45 years |
| Last Cut or Suspension | None |
📉 Dividend History
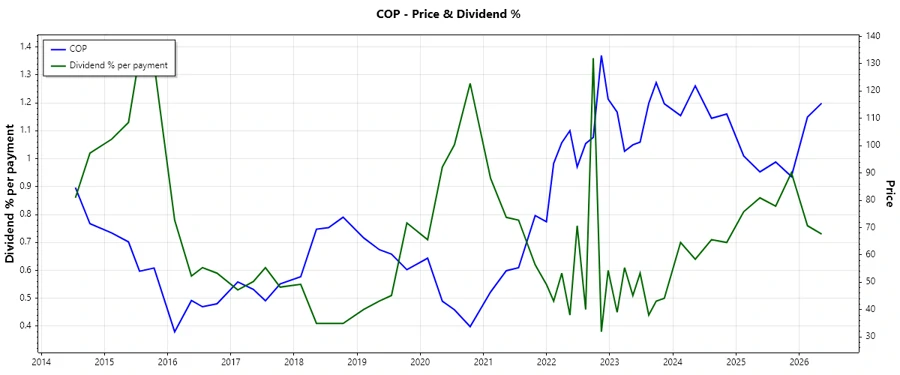
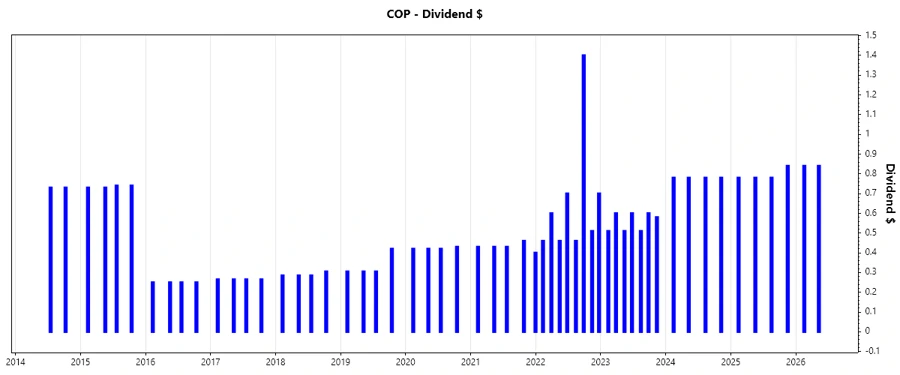
The dividend history of ConocoPhillips highlights its commitment to shareholders, with steady dividends over recent years. This consistency is crucial for assessing the reliability of future payouts.
| Year | Dividend Per Share (USD) |
|---|---|
| 2026 | 1.68 |
| 2025 | 3.18 |
| 2024 | 3.12 |
| 2023 | 3.91 |
| 2022 | 5.29 |
📈 Dividend Growth
The growth trends reflect the company's ability to enhance shareholder value over time. Examining recent patterns in dividend growth offers insights into future expectations, although recent trends show some decline.
| Time | Growth |
|---|---|
| 3 years | -0.16% |
| 5 years | 0.13% |
The average dividend growth is 0.13% over 5 years. This shows moderate but steady dividend growth.
Payout Ratio
The payout ratio is a key indicator of dividend sustainability. EPS-based and Free Cash Flow-based payout ratios are pivotal in evaluating the company's financial prudence regarding its dividend policy.
| Key Figure | Ratio |
|---|---|
| EPS-based | 53.34% |
| Free Cash Flow-based | 25.27% |
With an EPS payout ratio of 53.34% and an FCF payout ratio of 25.27%, ConocoPhillips maintains a balanced approach, potentially allowing for future dividend increases.
Cashflow & Capital Efficiency
These metrics offer insights into the company’s efficiency in generating and utilizing cash resources. Effective cash flow management underpins the ability to sustain dividend payments and investments.
| Metric | 2023 | 2024 | 2025 |
|---|---|---|---|
| Free Cash Flow Yield | 6.24% | 6.85% | 14.31% |
| Earnings Yield | 7.82% | 7.88% | 6.82% |
| CAPEX to Operating Cash Flow | 56.34% | 60.22% | 15.27% |
| Stock-based Compensation to Revenue | 0% | 0% | 0% |
| Free Cash Flow / Operating Cash Flow Ratio | 43.66% | 39.78% | 84.73% |
The stability of cash flows and consistent capital efficiency suggest the company’s resilience in funding its dividend and operational demands.
Balance Sheet & Leverage Analysis
Understanding leverage and liquidity ratios provides insight into the company’s financial stability. These metrics help assess the company's ability to manage its debts while maintaining enough liquidity.
| Metric | 2023 | 2024 | 2025 |
|---|---|---|---|
| Debt-to-Equity | 0.40 | 0.39 | 0.36 |
| Debt-to-Assets | 0.20 | 0.21 | 0.19 |
| Debt-to-Capital | 0.28 | 0.28 | 0.27 |
| Net Debt to EBITDA | 0.54 | 0.81 | 0.66 |
| Current Ratio | 1.43 | 1.29 | 1.30 |
| Quick Ratio | 1.29 | 1.14 | 1.14 |
| Financial Leverage | 1.95 | 1.89 | 1.89 |
ConocoPhillips demonstrates good financial health, with moderate leverage and strong liquidity positions aiding their ability to navigate varying economic conditions.
Fundamental Strength & Profitability
Profitability ratios like ROE and ROA are indicators of management efficiency. A strong margin profile adds robustness to earnings, impacting dividend sustainability.
| Metric | 2023 | 2024 | 2025 |
|---|---|---|---|
| Return on Equity | 22.16% | 14.23% | 12.39% |
| Return on Assets | 11.39% | 7.51% | 6.55% |
| Net Profit Margin | 19.48% | 16.88% | 13.60% |
| EBIT Margin | 30.95% | 27.06% | 23.66% |
| EBITDA Margin | 45.99% | 44.72% | 43.55% |
| Gross Profit Margin | 31.77% | 29.35% | 24.63% |
The company's solid profitability and controlled margins signify strong operational efficiency, contributing to sustained dividend payments.
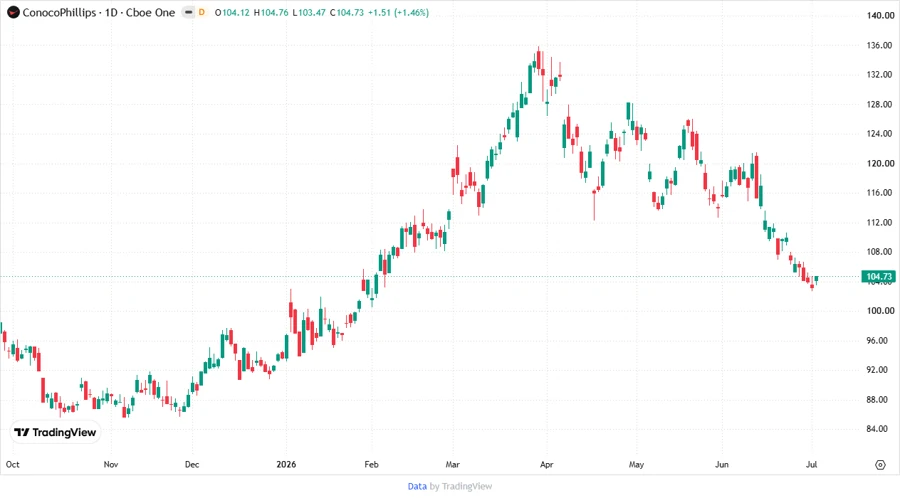
📈 Price Development
Dividend Scoring System
| Category | Description | Score |
|---|---|---|
| Dividend yield | Assesses the income generated from dividends | |
| Dividend Stability | Evaluates the consistency in dividend payments | |
| Dividend growth | Monitors the increase in dividend payments | |
| Payout ratio | Checks the proportion of earnings paid as dividends | |
| Financial stability | Assesses the company's overall financial health | |
| Dividend continuity | Tracks the unbroken history of dividend payouts | |
| Cashflow Coverage | Measures the ability of cash flows to cover dividends | |
| Balance Sheet Quality | Evaluates the strength of the company's balance sheet |
Total Score: 29/40
Rating
ConocoPhillips maintains a solid dividend strategy enhanced by its robust financial discipline. While recent dividend growth shows room for improvement, the stable payout and favorable financials argue for a HOLD recommendation with a watch for future dividend growth potential.
Smart Data Insight
Master the Perfect Entry & Exit for this Stock
Don't leave your profits to chance. Historically, this stock follows specific seasonal patterns that institutional traders use to maximize returns.
- ✅ Identify the "Golden Buying Window"
- ✅ Avoid high-risk correction cycles
- ✅ Backtested data from the last 20+ years