
June 20, 2026 a 07:31 am

COP: Dividend Analysis - ConocoPhillips
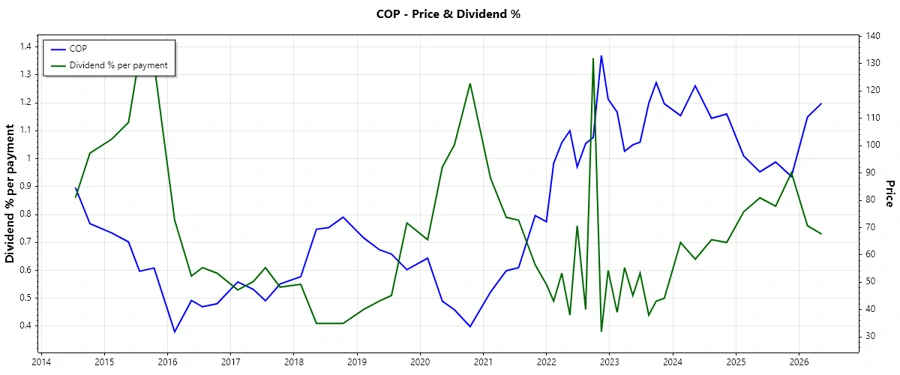
ConocoPhillips continues to demonstrate solid dividend returns, underscored by a longstanding history and a stable payout ratio. Despite recent volatility in the energy sector, ConocoPhillips provides investors with attractive yields and a commitment to shareholder returns. With over four decades of consistent dividend distributions, the company stands as a resilient entity in the volatile energy market. Investors should monitor diversifications in energy portfolios to accommodate sector-specific risks.
📊 Overview
| Factor | Details |
|---|---|
| Sector | Energy |
| Dividend Yield | 2.86% |
| Current Dividend Per Share | 3.19 USD |
| Dividend History | 45 years |
| Last Cut or Suspension | None |
💹 Dividend History
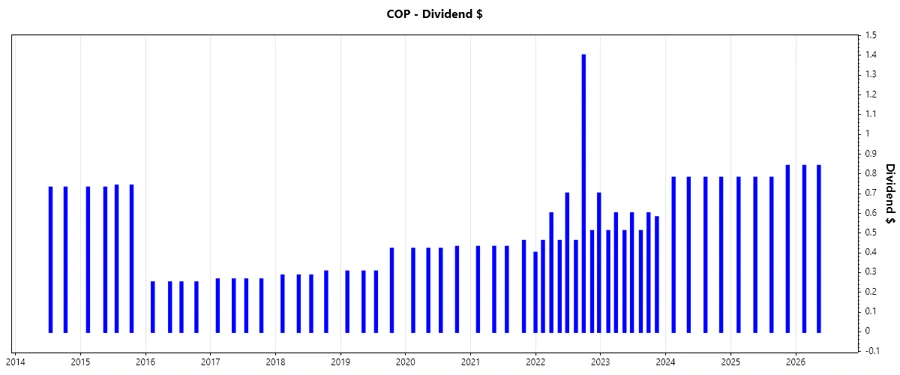
ConocoPhillips has a robust dividend track record, which aids in investor confidence and stabilizes stock price, especially amidst market fluctuations. This historical perspective reflects a commitment to returning value to shareholders through evolving market phases. Analyzing past distributions provides insights into company priorities and resilience.
| Year | Dividend Per Share (USD) |
|---|---|
| 2026 | 1.68 |
| 2025 | 3.18 |
| 2024 | 3.12 |
| 2023 | 3.91 |
| 2022 | 5.29 |
📈 Dividend Growth
Monitoring dividend growth is pivotal for understanding long-term value appreciation capacity. It reflects the company's financial health and its ability to augment investor capital. Despite sector challenges, ConocoPhillips shows adaptability through consistent yields, hinting at prudent management strategies.
| Time | Growth |
|---|---|
| 3 years | -0.16% |
| 5 years | 0.13% |
The average dividend growth is 0.13% over 5 years. This shows moderate but steady dividend growth.
🗣️ Payout Ratio
Payout ratios are critical in evaluating the sustainability of current dividend levels. They examine how much of earnings and cash flow are dedicated to dividends. ConocoPhillips displays a balanced EPS and FCF payout ratio, maintaining flexibility for reinvestments and mitigating risk during economic downturns.
| Key figure | Ratio |
|---|---|
| EPS-based | 53.34% |
| Free cash flow-based | 25.27% |
The EPS payout ratio of 53.34% reflects a healthy balance, ensuring dividends are not overly consuming earnings, while the FCF-based ratio at 25.27% highlights strong cash coverage.
💵 Cashflow & Capital Efficiency
Analyzing cash flow in conjunction with capital efficiency metrics provides a holistic view of operational efficacy and future growth potential. ConocoPhillips exhibits commendable cash flow yields and efficient capital allocation, supporting sustained shareholder value enhancement and operational robustness.
| Year | 2023 | 2024 | 2025 |
|---|---|---|---|
| Free Cash Flow Yield | 6.24% | 6.85% | 14.31% |
| Earnings Yield | 7.82% | 7.88% | 6.81% |
| CAPEX to Operating Cash Flow | 56.34% | 60.22% | 15.27% |
| Stock-based Compensation to Revenue | 0% | 0% | 0% |
| Free Cash Flow / Operating Cash Flow Ratio | 43.66% | 39.78% | 84.73% |
Strong free cash flow yield and limited stock-based compensation illustrate considerable top-line health. ConocoPhillips aligns well with efficient capital management principles.
🧾 Balance Sheet & Leverage Analysis
Understanding a company's leverage and liquidity metrics provides insights into its financial equilibrium and debt management. ConocoPhillips capitalizes on strategic debt utilization balanced with robust capitalization, poised for resilient growth across varied market conditions.
| Year | 2023 | 2024 | 2025 |
|---|---|---|---|
| Debt-to-Equity | 0.40 | 0.39 | 0.36 |
| Debt-to-Assets | 0.20 | 0.21 | 0.19 |
| Debt-to-Capital | 0.28 | 0.28 | 0.27 |
| Net Debt to EBITDA | 0.54 | 0.81 | 0.66 |
| Current Ratio | 1.43 | 1.29 | 1.30 |
| Quick Ratio | 1.29 | 1.14 | 1.14 |
| Financial Leverage | 1.95 | 1.89 | 1.89 |
ConocoPhillips maintains a stable leverage profile, with prudent utilization of debt supporting operational flexibility without compromising financial health.
📏 Fundamental Strength & Profitability
These metrics are critical to deciphering the company's long-term earning potential and competitive advantage. ConocoPhillips showcases healthy profitability indicators, reflecting sound operational choices and resource optimization.
| Year | 2023 | 2024 | 2025 |
|---|---|---|---|
| Return on Equity | 22.16% | 14.23% | 12.39% |
| Return on Assets | 11.39% | 7.51% | 6.55% |
| Margins - Net | 19.48% | 16.88% | 13.60% |
| Margins - EBIT | 30.95% | 27.06% | 23.66% |
| Margins - EBITDA | 45.00% | 44.72% | 43.55% |
| Margins - Gross | 31.77% | 29.35% | 24.63% |
| R&D to Revenue | 0.14% | 0.15% | 0.13% |
The profitability metrics highlight ConocoPhillips' efficient cost management and strategic reinvestment practices, proving its capability to thrive and deliver shareholder value.
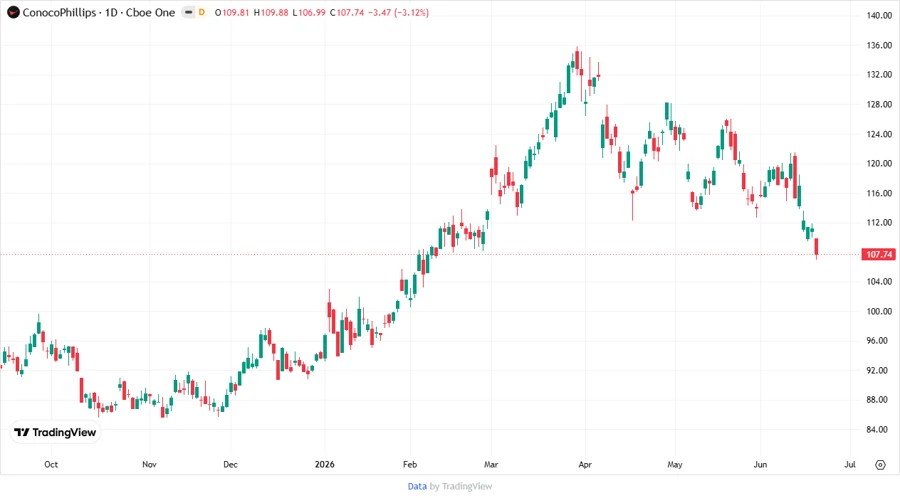
💹 Price Development
🎯 Dividend Scoring System
| Factor | Score | Scoring Bar |
|---|---|---|
| Dividend yield | 4 | |
| Dividend Stability | 5 | |
| Dividend growth | 3 | |
| Payout ratio | 4 | |
| Financial stability | 5 | |
| Dividend continuity | 5 | |
| Cashflow Coverage | 4 | |
| Balance Sheet Quality | 4 |
Overall Score: 34/40
🧩 Rating
ConocoPhillips is a compelling investment opportunity for dividend-focused investors seeking stable returns with modest growth potential. The company's solid fundamentals, combined with consistent capital management, underscore its robust capability to uphold shareholder value amidst industry volatilities. Recommended as a strong hold for income-seeking portfolios.
Smart Data Insight
Master the Perfect Entry & Exit for this Stock
Don't leave your profits to chance. Historically, this stock follows specific seasonal patterns that institutional traders use to maximize returns.
- ✅ Identify the "Golden Buying Window"
- ✅ Avoid high-risk correction cycles
- ✅ Backtested data from the last 20+ years