May 04, 2026 a 03:31 pm

COP: Dividend Analysis - ConocoPhillips
ConocoPhillips has a well-established dividend history with 45 consecutive years of dividends. Despite a challenging market environment, their strong financial health and consistent performance make them a potentially rewarding investment for dividend investors.
📊 Overview
ConocoPhillips operates within the Energy sector, a segment known for high capital expenditure and cyclical revenue streams. Their current dividend yield stands at 2.68%, with a dividend per share of 3.19 USD. The company has been paying dividends for 45 years, with no recent cuts or suspensions.
| Metric | Value |
|---|---|
| Sector | Energy |
| Dividend Yield | 2.68% |
| Current Dividend Per Share | 3.19 USD |
| Dividend History | 45 years |
| Last Cut or Suspension | None |
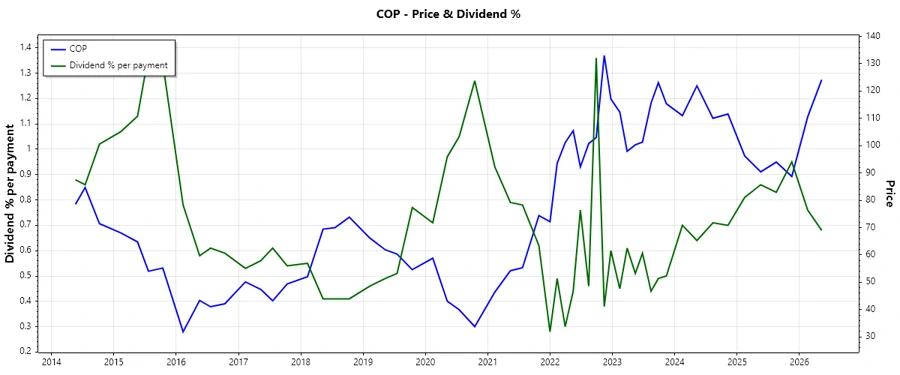
🗣️ Dividend History
ConocoPhillips has demonstrated a commitment to returning value to shareholders through dividends. A consistent history is indicative of strong, steady cash flows and management's focus on shareholder value.
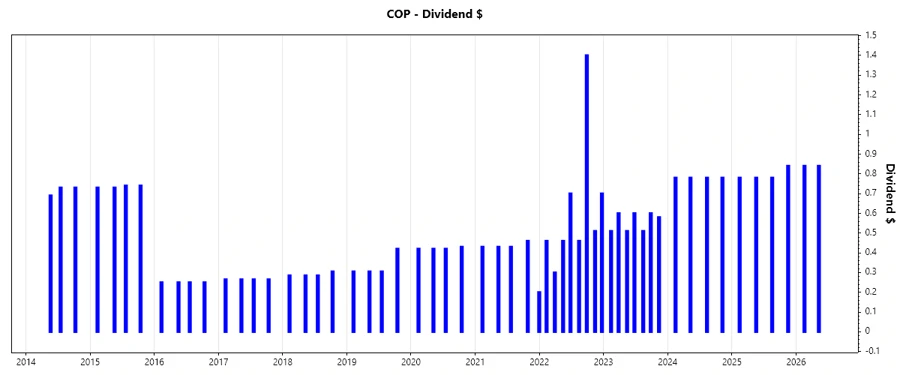
| Year | Dividend Per Share (USD) |
|---|---|
| 2026 | 1.68 |
| 2025 | 3.18 |
| 2024 | 3.12 |
| 2023 | 3.91 |
| 2022 | 4.99 |
📈 Dividend Growth
The growth of dividends over time is crucial for measuring management's ability to increase shareholder returns. ConocoPhillips has shown moderate dividend changes with recent fluctuations.
| Time | Growth |
|---|---|
| 3 years | -0.14% |
| 5 years | 0.13% |
The average dividend growth is 0.13% over 5 years. This shows moderate but steady dividend growth.
✅ Payout Ratio
Payout ratios provide insight into how much earnings are returned to shareholders as dividends. A balance is required to maintain a healthy reinvestment strategy while rewarding shareholders.
| Key Figure | Ratio |
|---|---|
| EPS-based | 53.34% |
| Free Cash Flow-based | 22.07% |
With a payout ratio of 53.34% based on EPS and 22.07% based on FCF, ConocoPhillips appears to be managing its dividend commitments effectively, ensuring sustainability.
🔍 Cashflow & Capital Efficiency
Analyzing cash flow metrics provides a snapshot of operational efficiency and sustainability of financial strategies over time. ConocoPhillips shows strong cash flow coverage relative to its dividends.
| Metric | 2023 | 2024 | 2025 |
|---|---|---|---|
| Free Cash Flow Yield | 6.24% | 6.85% | 14.31% |
| Earnings Yield | 7.82% | 7.88% | 6.82% |
| CAPEX to Operating Cash Flow | 56.34% | 60.22% | 15.27% |
| Stock-based Compensation to Revenue | 0% | 0% | 0% |
| Free Cash Flow / Operating Cash Flow Ratio | 43.66% | 39.78% | 84.73% |
These figures dictate the operational health and strategic deployment of capital, which supports its dividend policies and indicates robust cash management practices.
🏦 Balance Sheet & Leverage Analysis
Examining leverage showcases the degree of financial risk through obligations. ConocoPhillips maintains healthier levels of debt relative to equity, indicating controlled leverage and stability.
| Metric | 2023 | 2024 | 2025 |
|---|---|---|---|
| Debt-to-Equity | 39.84% | 39.12% | 36.35% |
| Debt-to-Assets | 20.47% | 20.65% | 19.23% |
| Debt-to-Capital | 28.49% | 28.12% | 26.66% |
| Net Debt to EBITDA | 0.543 | 0.808 | 0.731 |
| Current Ratio | 1.43 | 1.29 | 1.29 |
| Quick Ratio | 1.29 | 1.14 | 1.14 |
| Financial Leverage | 1.947 | 1.895 | 1.891 |
With stable liquidity ratios, the company sustains robust financial health and strategic financing decisions.
🧩 Fundamental Strength & Profitability
Profitability metrics such as returns on equity and assets are crucial for gauging the financial performance. ConocoPhillips exhibits strong profitability markers, highlighting operational efficiency.
| Metric | 2023 | 2024 | 2025 |
|---|---|---|---|
| Return on Equity | 22.16% | 14.23% | 12.39% |
| Return on Assets | 11.39% | 7.51% | 6.55% |
| Margins: Net | 19.48% | 16.88% | 13.60% |
| Margins: EBIT | 30.95% | 27.06% | 19.58% |
| Margins: EBITDA | 45.99% | 44.72% | 39.47% |
| Margins: Gross | 31.77% | 29.35% | 24.63% |
| Research & Development to Revenue | 0.14% | 0.15% | 0.13% |
The increased efficiency in asset and equity utilization marks ConocoPhillips as a strong contender in profitability and fundamental health.
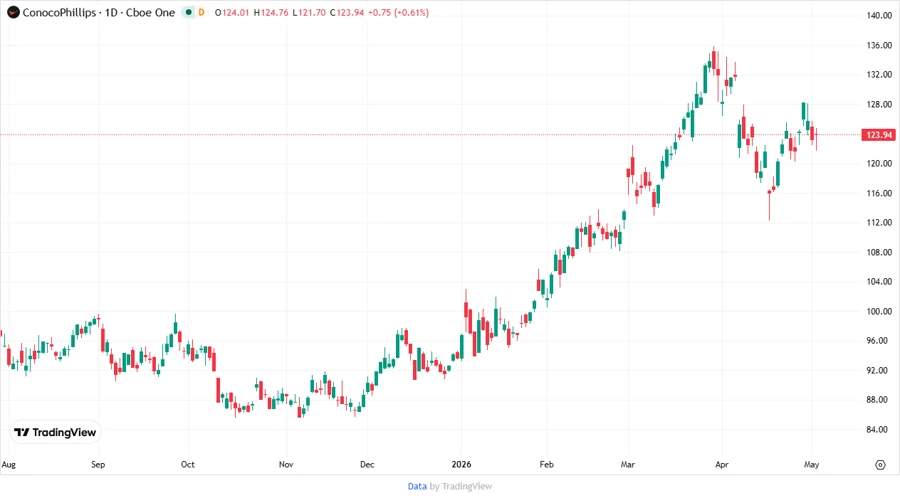
📉 Price Development
⭐ Dividend Scoring System
| Category | Score (1-5) | Score Bar |
|---|---|---|
| Dividend Yield | 3 | |
| Dividend Stability | 4 | |
| Dividend Growth | 2 | |
| Payout Ratio | 4 | |
| Financial Stability | 4 | |
| Dividend Continuity | 5 | |
| Cashflow Coverage | 3 | |
| Balance Sheet Quality | 4 |
Overall Score: 29/40
📝 Rating
ConocoPhillips presents a stable option for dividend investors, offering a blend of consistent payouts and strong fundamental health. With prudent financial management, it remains a viable candidate for those seeking long-term dividend income. Moderate growth and robust stability make it an attractive portfolio component, especially for investors prioritizing steady income over aggressive growth.
Smart Data Insight
Master the Perfect Entry & Exit for this Stock
Don't leave your profits to chance. Historically, this stock follows specific seasonal patterns that institutional traders use to maximize returns.
- ✅ Identify the "Golden Buying Window"
- ✅ Avoid high-risk correction cycles
- ✅ Backtested data from the last 20+ years