September 14, 2025 a 03:32 am

COP: Dividend Analysis - ConocoPhillips
ConocoPhillips, a prominent player in the energy sector, showcases a resilient dividend profile. With a current dividend yield of 3.32% and a commitment to stable payouts over the past 44 years, the company reflects a strong inclination towards shareholder returns. Despite the volatility in the energy market, ConocoPhillips has sustained its dividend without recent cuts, reinforcing investor confidence.
Overview 📊
ConocoPhillips operates within the energy sector, renowned for its substantial cash flows and return potential. The company currently offers a dividend yield of 3.32%, with a present dividend per share at 3.09 USD. Over the past 44 years, ConocoPhillips has maintained a steady dividend history, with no recent cuts or suspensions, which signifies its robust financial health and commitment to return value to shareholders.
| Detail | Value |
|---|---|
| Sector | Energy |
| Dividend Yield | 3.32% |
| Current Dividend Per Share | 3.09 USD |
| Dividend History | 44 years |
| Last Cut or Suspension | None |
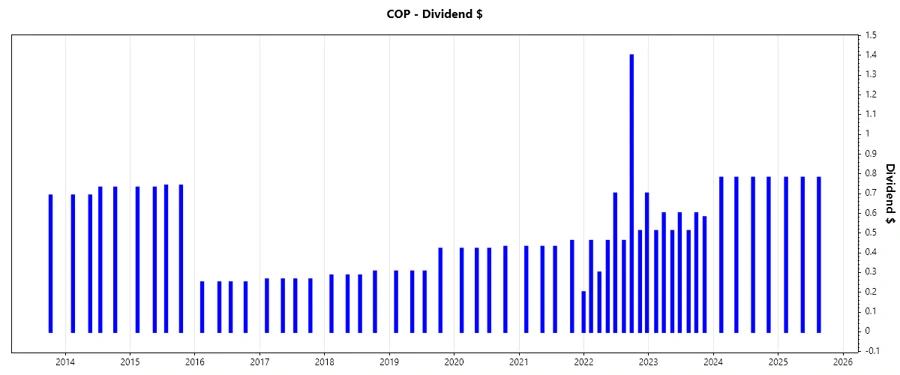
Dividend History 📈
The dividend history of ConocoPhillips highlights its long-standing commitment to returning cash to shareholders. With consistent dividend payments over four decades, it reflects the company's financial resilience and management's confidence in future cash flow sustainability.
| Year | Dividend Per Share (USD) |
|---|---|
| 2025 | 2.34 |
| 2024 | 3.12 |
| 2023 | 3.91 |
| 2022 | 4.99 |
| 2021 | 1.95 |
Dividend Growth ✅
Understanding dividend growth is crucial for evaluating future income potential. ConocoPhillips has achieved a 3-year dividend growth rate of 16.96% and a 5-year growth rate of 18.50%, indicating moderate but positive growth momentum.
| Time | Growth |
|---|---|
| 3 years | 16.96% |
| 5 years | 18.50% |
The average dividend growth is 18.50% over 5 years. This shows moderate but steady dividend growth.
Payout Ratio 🗣️
The payout ratio is a vital measure to assess the sustainability of dividend payments. ConocoPhillips exhibits a 42.48% payout based on EPS and 55.79% based on free cash flow, falling within a conservative range. The company maintains a healthy balance, ensuring dividends are secure while allowing room for reinvestment.
| Key figure | Ratio |
|---|---|
| EPS-based | 42.48% |
| Free cash flow-based | 55.79% |
The 42.48% payout ratio based on EPS and the 55.79% based on FCF indicate a balanced approach to shareholder returns and business reinvestment.
Cashflow & Capital Efficiency 📉
Cash flow generation and capital efficiency signify a company's ability to sustain operations and dividends without external financing. ConocoPhillips achieves a free cash flow yield of 5.99% and an earnings yield of 7.88%, showcasing effective resource management.
| Metric | 2024 | 2023 | 2022 |
|---|---|---|---|
| Free Cash Flow Yield | 6.85% | 6.24% | 12.08% |
| Earnings Yield | 7.88% | 7.82% | 12.39% |
| CAPEX to Operating Cash Flow | 60.22% | 56.34% | 35.88% |
| Stock-based Compensation to Revenue | 0.00% | 0.00% | 0.48% |
| Free Cash Flow / Operating Cash Flow Ratio | 39.78% | 43.66% | 64.12% |
ConocoPhillips' consistent positive cash flow metrics indicate operational efficiency and the ability to fund dividends and growth internally.
Balance Sheet & Leverage Analysis 💡
A robust balance sheet ensures financial resilience. ConocoPhillips has a debt-to-equity ratio of 39.12% and a current ratio above 1, indicating adequate liquidity. Low leverage ratios enhance the company's ability to navigate economic fluctuations.
| Metric | 2024 | 2023 | 2022 |
|---|---|---|---|
| Debt-to-Equity | 39.12% | 39.84% | 35.81% |
| Debt-to-Assets | 20.65% | 20.47% | 18.32% |
| Debt-to-Capital | 28.12% | 28.49% | 26.37% |
| Net Debt to EBITDA | 0.81 | 0.54 | 0.29 |
| Current Ratio | 1.29 | 1.43 | 1.46 |
| Quick Ratio | 1.14 | 1.29 | 1.36 |
| Financial Leverage | 1.89 | 1.95 | 1.95 |
With low leverage and strong liquidity ratios, ConocoPhillips' balance sheet supports its financial stability and growth potential even during downturns.
Fundamental Strength & Profitability ⚖️
Profitability metrics reveal how effectively a company converts revenue into profit. ConocoPhillips demonstrates robust profitability with a high return on equity and consistent net margins, underpinning its ability to deliver shareholder value.
| Metric | 2024 | 2023 | 2022 |
|---|---|---|---|
| Return on Equity | 14.23% | 22.16% | 38.79% |
| Return on Assets | 7.51% | 11.39% | 19.84% |
| Net Profit Margin | 16.88% | 19.45% | 23.69% |
| EBIT Margin | 27.06% | 30.91% | 37.26% |
| EBITDA Margin | 44.72% | 45.93% | 47.25% |
| Gross Margin | 29.35% | 32.42% | 37.70% |
| Research & Development to Revenue | 0.15% | 0.15% | 0.09% |
ConocoPhillips excels in profitability, with high margins across key metrics, indicating efficient operations and strong competitive positioning.
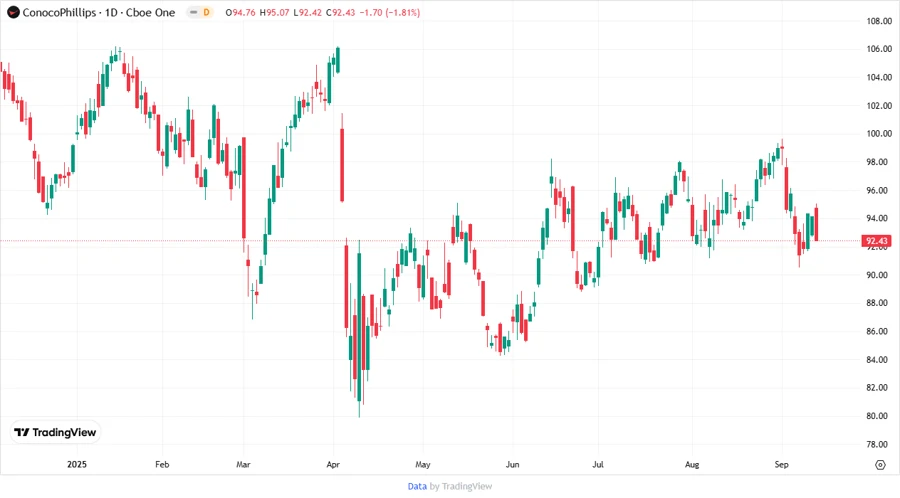
Price Development 📊
Dividend Scoring System 🏅
| Category | Score | Indicator |
|---|---|---|
| Dividend Yield | 4 | |
| Dividend Stability | 5 | |
| Dividend Growth | 3 | |
| Payout Ratio | 4 | |
| Financial Stability | 5 | |
| Dividend Continuity | 5 | |
| Cashflow Coverage | 4 | |
| Balance Sheet Quality | 5 |
Total Score: 35/40
Rating ⭐
ConocoPhillips exhibits a strong dividend profile supported by excellent financial health and stable cash flows. With a compelling dividend yield and prudent payout ratios, it is well-positioned for continued shareholder returns. This analysis suggests a robust investment opportunity for income-focused investors. Overall Rating: Highly Favorable.
Smart Data Insight
Master the Perfect Entry & Exit for this Stock
Don't leave your profits to chance. Historically, this stock follows specific seasonal patterns that institutional traders use to maximize returns.
- ✅ Identify the "Golden Buying Window"
- ✅ Avoid high-risk correction cycles
- ✅ Backtested data from the last 20+ years