September 07, 2025 a 12:47 pm


COP: Dividend Analysis - ConocoPhillips
ConocoPhillips presents a compelling dividend profile, marked by consistent payments and a noteworthy history of 44 consecutive years of dividends. The company showcases a balanced payout ratio and a moderate dividend yield, which underscores its capability to sustain dividends in varying market conditions.
📊 Overview
ConocoPhillips operates within the Energy sector, capitalizing on its extensive experience and market position to maintain a robust dividend profile. Key attributes include a current dividend yield of 3.32% and a history of 44 years without a cut, indicating resilience and strong cash flow management.
| Key Metrics | Values |
|---|---|
| Sector | Energy |
| Dividend Yield | 3.32% |
| Current Dividend per Share | 3.09 USD |
| Dividend History | 44 years |
| Last Cut or Suspension | None |
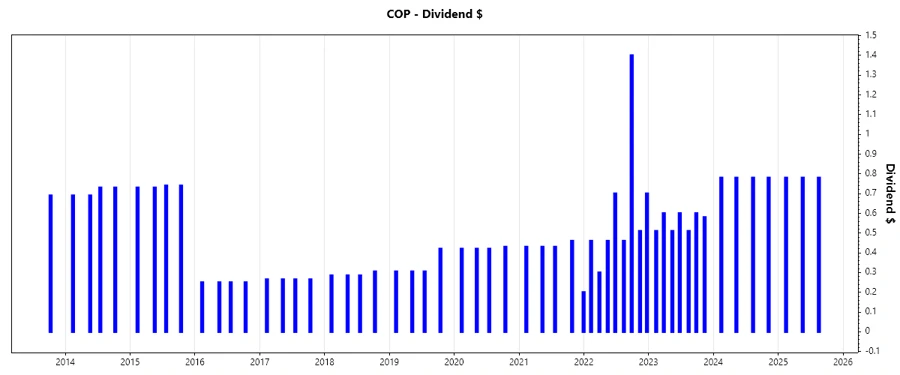
📈 Dividend History
The dividend history of ConocoPhillips reflects a consistent commitment to returning value to shareholders. Sustained dividend payments over 44 years highlight the company's stable financial performance. This reliability is crucial for investors seeking steady income streams.
| Year | Dividend per Share (USD) |
|---|---|
| 2025 | 2.34 |
| 2024 | 3.12 |
| 2023 | 3.91 |
| 2022 | 4.99 |
| 2021 | 1.95 |
📈 Dividend Growth
Dividend growth is a key indicator of a company’s ability to enhance shareholder returns over time. ConocoPhillips has demonstrated moderate growth rates, with a 5-year average growth of 18.50%, suggesting the potential for increased payouts reflective of financial health.
| Time | Growth |
|---|---|
| 3 years | 16.96% |
| 5 years | 18.50% |
The average dividend growth is 18.50% over 5 years. This shows moderate but steady dividend growth.
💹 Payout Ratio
Payout ratios are instrumental in assessing a company’s ability to maintain and increase dividends. ConocoPhillips exhibits an EPS-based payout ratio of 42.48% and an FCF-based ratio of 55.79%, suggesting a cautious yet progressive dividend policy, ensuring sustainability.
| Key Figure | Ratio |
|---|---|
| EPS-based | 42.48% |
| Free Cash Flow-based | 55.79% |
The calculated payout ratios indicate that ConocoPhillips is efficiently managing earnings and cash flows, balancing reinvestment and shareholder returns.
🔍 Cashflow & Capital Efficiency
Evaluating cash flow metrics and capital efficiency provides a deeper insight into financial stability and operational agility. ConocoPhillips’ cash flow metrics reveal a proactive approach to capital allocation and efficiency improvement.
| Metric/Year | 2022 | 2023 | 2024 |
|---|---|---|---|
| Free Cash Flow Yield | 12.08% | 6.24% | 6.85% |
| Earnings Yield | 12.39% | 7.82% | 7.88% |
| CAPEX to Operating Cash Flow | 35.88% | 56.34% | 60.22% |
| Stock-based Compensation to Revenue | 0.48% | 0% | 0% |
| Free Cash Flow / Operating Cash Flow Ratio | 64.12% | 43.66% | 39.78% |
The consistency and reliability of these ratios suggest ConocoPhillips’ adeptness at maintaining robust cash flow and capital efficiency, crucial for long-term dividend sustainability.
📉 Balance Sheet & Leverage Analysis
The balance sheet’s leverage metrics are indicative of financial health and risk exposure. ConocoPhillips manages its obligations efficiently, maintaining stability even with a conservative debt approach.
| Metric/Year | 2022 | 2023 | 2024 |
|---|---|---|---|
| Debt-to-Equity | 35.81% | 39.84% | 39.12% |
| Debt-to-Assets | 18.32% | 20.47% | 20.65% |
| Debt-to-Capital | 26.37% | 28.49% | 28.12% |
| Net Debt to EBITDA | 0.29 | 0.54 | 0.81 |
| Current Ratio | 1.46 | 1.43 | 1.29 |
| Quick Ratio | 1.36 | 1.29 | 1.14 |
| Financial Leverage | 1.95 | 1.95 | 1.89 |
ConocoPhillips demonstrates effective debt management strategies, sustaining financial flexibility and capability for future growth initiatives.
💼 Fundamental Strength & Profitability
Profitability metrics are vital indicators of a company’s operational competence. ConocoPhillips exhibits commendable return metrics and margins reflecting solid operational performance.
| Metric/Year | 2022 | 2023 | 2024 |
|---|---|---|---|
| Return on Equity | 38.79% | 22.16% | 14.23% |
| Return on Assets | 19.84% | 11.39% | 7.51% |
| Net Margin | 23.69% | 19.45% | 16.88% |
| EBIT Margin | 37.26% | 30.91% | 27.06% |
| EBITDA Margin | 47.25% | 45.93% | 44.72% |
| Gross Margin | 37.70% | 32.42% | 29.35% |
| R&D to Revenue | 0.09% | 0% | 0.07% |
The robust profitability performance buttresses ConocoPhillips' value proposition, underpinning future growth potential and market competitiveness.
📈 Price Development
✅ Dividend Scoring System
| Criteria | Score | Score Bar |
|---|---|---|
| Dividend Yield | 4 | |
| Dividend Stability | 5 | |
| Dividend Growth | 4 | |
| Payout Ratio | 4 | |
| Financial Stability | 5 | |
| Dividend Continuity | 5 | |
| Cashflow Coverage | 4 | |
| Balance Sheet Quality | 4 |
Total Score: 35/40
🗣️ Rating
Overall, ConocoPhillips presents a robust dividend profile with consistent historical performance and stability. The company’s financial health supports a secure and promising dividend trajectory, making it a strong candidate for income-focused portfolios.
Smart Data Insight
Master the Perfect Entry & Exit for this Stock
Don't leave your profits to chance. Historically, this stock follows specific seasonal patterns that institutional traders use to maximize returns.
- ✅ Identify the "Golden Buying Window"
- ✅ Avoid high-risk correction cycles
- ✅ Backtested data from the last 20+ years