August 11, 2025 a 07:31 am


COP: Dividend Analysis - ConocoPhillips
ConocoPhillips exhibits a robust dividend profile with impressive stability and attractive yields. The company's consistent payment history, steady growth, and solid financial footing make it a compelling choice for income-seeking investors. However, prudent assessment of its financial health and potential growth trajectories is advised to ensure alignment with investment objectives.
📊 Overview
ConocoPhillips, a significant player in the energy sector, maintains a strong presence with a market cap exceeding $117 billion. Its dividend strategy underscores a yielding environment for investors, enhanced by a rich history of 44 years of consecutive dividend distributions.
| Metric | Value |
|---|---|
| Sector | Energy |
| Dividend Yield | 3.32% |
| Current Dividend Per Share | 3.09 USD |
| Dividend History | 44 years |
| Last Cut or Suspension | None |
📉 Dividend History
The historical consistency of ConocoPhillips' dividend payments underscores the stability and resilience of the firm. This reliability is paramount for investors prioritizing steady income streams over long-term growth.
| Year | Dividend Per Share |
|---|---|
| 2025 | 2.34 |
| 2024 | 3.12 |
| 2023 | 3.91 |
| 2022 | 4.99 |
| 2021 | 1.95 |
📈 Dividend Growth
The growth trajectory of ConocoPhillips' dividends reflects a strategic initiative aimed at value creation for its shareholders, balancing immediate income benefits with long-term capital appreciation.
| Time | Growth |
|---|---|
| 3 years | 16.96% |
| 5 years | 18.50% |
The average dividend growth is 18.50% over 5 years. This shows moderate but steady dividend growth.
🗣️ Payout Ratio
ConocoPhillips' payout ratios illustrate its balanced approach to profit distribution, wherein it efficiently converts earnings into dividends, ensuring sustainability and cash flow adequacy.
| Key Figure | Ratio |
|---|---|
| EPS-based | 42.48% |
| Free cash flow-based | 55.79% |
The EPS-based payout ratio of 42.48% indicates a well-covered dividend, while a free cash flow-based ratio of 55.79% suggests prudent financial management.
🧮 Cashflow & Capital Efficiency
ConocoPhillips' cash flow and capital efficiency metrics highlight its capacity to generate sustainable free cash flows while maintaining operational efficiency, crucial for long-term strategic investments.
| Metric | 2024 | 2023 | 2022 |
|---|---|---|---|
| Free Cash Flow Yield | 6.85% | 6.24% | 12.08% |
| Earnings Yield | 7.88% | 7.82% | 12.39% |
| CAPEX to Operating Cash Flow | 60.22% | 56.34% | 35.88% |
| Stock-based Compensation to Revenue | 0% | 0% | 0.48% |
| Free Cash Flow / Operating Cash Flow Ratio | 39.78% | 43.66% | 64.12% |
Overall, ConocoPhillips showcases robust cash flow generation and capital deployment, ensuring strategic flexibility and investment capability.
💼 Balance Sheet & Leverage Analysis
Examining the balance sheet and leverage metrics of ConocoPhillips confirms a firm groundwork for debt repayment capacity and liquidity, propelling it favorably through varying market conditions.
| Metric | 2024 | 2023 | 2022 |
|---|---|---|---|
| Debt-to-Equity | 0.39 | 0.40 | 0.36 |
| Debt-to-Assets | 0.21 | 0.20 | 0.18 |
| Debt-to-Capital | 0.28 | 0.28 | 0.26 |
| Net Debt to EBITDA | 0.81 | 0.54 | 0.29 |
| Current Ratio | 1.29 | 1.43 | 1.46 |
| Quick Ratio | 1.14 | 1.29 | 1.36 |
| Financial Leverage | 1.89 | 1.95 | 1.95 |
With a solid balance sheet and controlled leverage, ConocoPhillips secures a steadfast pool of resources to manage fiscal obligations and facilitate growth.
🔍 Fundamental Strength & Profitability
The company's strong profitability metrics and efficiency ratios portray its competitive edge and operational acuity, which bolster investor confidence in its long-term business model.
| Metric | 2024 | 2023 | 2022 |
|---|---|---|---|
| Return on Equity | 14.23% | 22.16% | 38.79% |
| Return on Assets | 7.51% | 11.39% | 19.84% |
| Net Margin | 16.88% | 19.45% | 23.69% |
| EBIT Margin | 27.06% | 30.91% | 37.26% |
| EBITDA Margin | 44.72% | 45.93% | 47.25% |
| Gross Margin | 29.35% | 32.42% | 37.70% |
| Research & Development to Revenue | 0.15% | 0% | 0.05% |
These financial markers define ConocoPhillips as a fundamentally sturdy organization with effective profitability levers, crucial for sustaining dividend distributions.
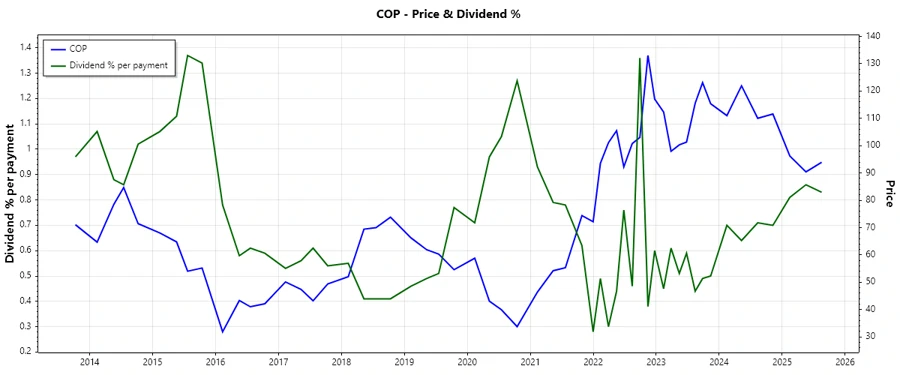
💵 Price Development
✅ Dividend Scoring System
| Criterion | Score | Bar |
|---|---|---|
| Dividend Yield | 4 | |
| Dividend Stability | 5 | |
| Dividend Growth | 4 | |
| Payout Ratio | 4 | |
| Financial Stability | 5 | |
| Dividend Continuity | 5 | |
| Cashflow Coverage | 4 | |
| Balance Sheet Quality | 5 |
Overall Score: 36/40
🟢 Rating
ConocoPhillips is bestowed with a high rating due to its strong financial position, consistent dividend history, and solid growth prospects. It is recommended for investors looking for a stable dividend yield combined with potential capital appreciation.
Smart Data Insight
Master the Perfect Entry & Exit for this Stock
Don't leave your profits to chance. Historically, this stock follows specific seasonal patterns that institutional traders use to maximize returns.
- ✅ Identify the "Golden Buying Window"
- ✅ Avoid high-risk correction cycles
- ✅ Backtested data from the last 20+ years