
June 29, 2026 a 09:03 am
COO: Trend and Support & Resistance Analysis - The Cooper Companies, Inc.
The Cooper Companies, Inc. (COO) shows a volatile yet promising market potential. With its strong foothold in the global medical device industry, COO is focused on innovative eye care solutions and comprehensive women's health products. Recent trends indicate fluctuating market positions. In-depth analysis using technical indicators can help anticipate future movements in the stock price. Investors should consider both fundamental and technical factors when evaluating the stock.
Trend Analysis
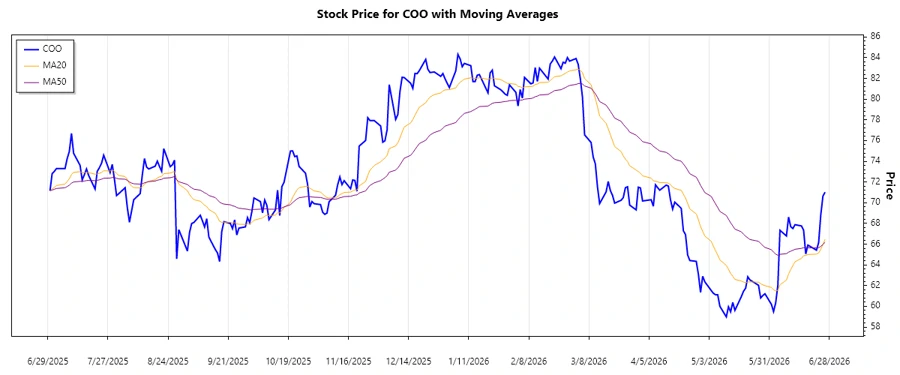
The analysis of COO's stock shows complex movements over the recent months with an alternation between upward and downward trajectories, revealing the dynamics of investor sentiments and market conditions.
| Date | Close Price | Trend |
|---|---|---|
| 2026-06-26 | $71.02 | ▲ |
| 2026-06-25 | $70.64 | ▲ |
| 2026-06-24 | $68.83 | ▼ |
| 2026-06-23 | $66.15 | ▼ |
| 2026-06-22 | $65.42 | ▼ |
| 2026-06-18 | $65.91 | ▲ |
| 2026-06-17 | $65.05 | ▼ |
By calculating EMA20 and EMA50 from the given data, the EMA20 is currently above EMA50, indicating a slight upward momentum in the short-term. This interplay proposes the possibility of a continuation in the upward trend, suggesting potential buy opportunities.
Support and Resistance
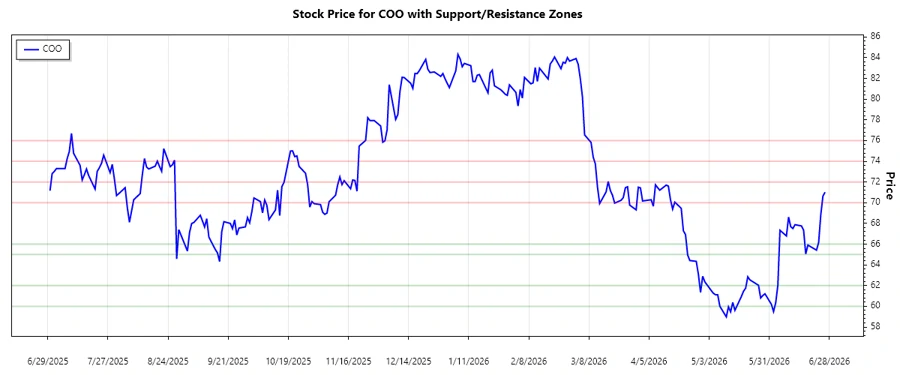
Support and resistance zones reflect the recent price actions and traders’ psychological benchmarks. Identifying these zones is key to predicting price actions.
| Zone | From | To |
|---|---|---|
| Support 1 | $65.00 | $66.00 |
| Support 2 | $60.00 | $62.00 |
| Resistance 1 | $70.00 | $72.00 |
| Resistance 2 | $74.00 | $76.00 |
Currently, the price hovers near the first resistance zone, indicating a potential reversal if not breached. However, if breached, it might target the resistance zone 2.
Conclusion
The current trend indicates a potential uptrend, enhancing investment opportunities. However, the presence near the resistance zone requires cautious investment decisions. Sustained breaches of resistance levels could denote stronger upward movements, but failure may switch focus back to support zones. Monitoring market news and related developments in the medical device sector can provide further context for stock movements.
Smart Data Insight
Master the Perfect Entry & Exit for this Stock
Don't leave your profits to chance. Historically, this stock follows specific seasonal patterns that institutional traders use to maximize returns.
- ✅ Identify the "Golden Buying Window"
- ✅ Avoid high-risk correction cycles
- ✅ Backtested data from the last 20+ years