October 08, 2025 a 02:04 pm
COO: Trend and Support & Resistance Analysis - The Cooper Companies, Inc.
In the given period, The Cooper Companies, Inc. has shown significant volatility. The recent months have portrayed a shift from previous highs towards lower ranges, influenced by both broader market conditions and company-specific news. Investors need to consider both the technical signals and industry outlook when evaluating this stock. The Cooper Companies has a diverse business model in the healthcare sector, providing potential for growth despite short-term price fluctuations.
Trend Analysis
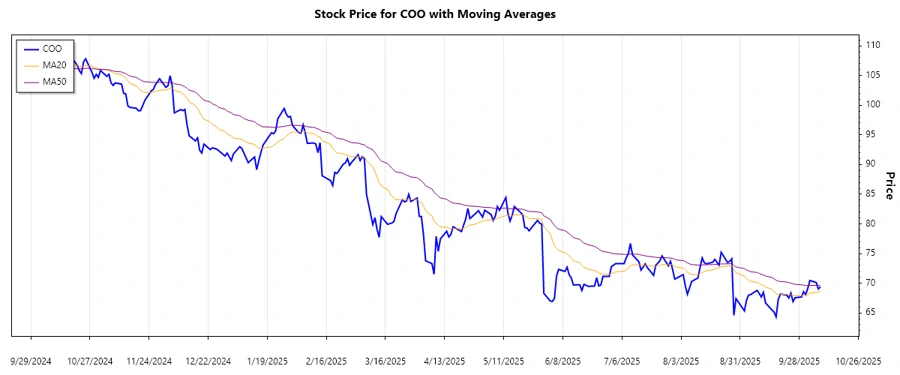
The trend analysis for The Cooper Companies, Inc. (Ticker: COO) shows changes in market sentiment over the reviewed timeframe. Using the Exponential Moving Average (EMA) for 20 and 50 days offers insight into the current trend.
| Date | Closing Price | Trend |
|---|---|---|
| 2025-10-08 | 69.36 | ▼ |
| 2025-10-07 | 69.02 | ▼ |
| 2025-10-06 | 70.11 | ⚖️ |
| 2025-10-03 | 70.46 | ▲ |
| 2025-10-02 | 69.12 | ▼ |
| 2025-10-01 | 68.07 | ▼ |
| 2025-09-30 | 68.56 | ▼ |
The current analysis shows a ▼ downtrend as the EMA20 is below the EMA50. This suggests a bearish sentiment in the market.
Support and Resistance
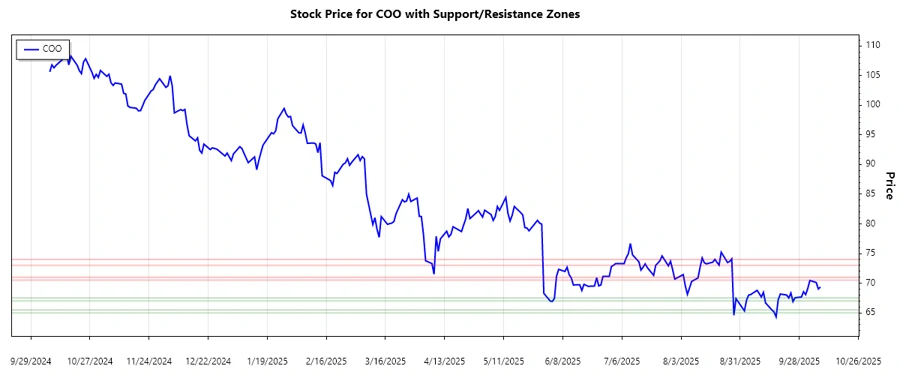
The identified support and resistance zones provide insight into potential price reversals or continuations. These levels are critical for traders as they plan their entry and exit points.
| Zone Type | From | To |
|---|---|---|
| Support 1 | 67.00 | 67.50 |
| Support 2 | 65.00 | 65.50 |
| Resistance 1 | 70.50 | 71.00 |
| Resistance 2 | 73.00 | 74.00 |
Currently, the stock remains within a support zone (67.00 - 67.50), indicating a possible rebound from these levels. Further price decreases could test the lower support zone.
Conclusion
The technical analysis of The Cooper Companies, Inc. suggests a dominantly bearish trend with a current positioning in a support zone. For investors, this may indicate caution should be exercised. Factors such as business model diversification in contact lenses and women’s health could provide resilience. Market participants should closely monitor upcoming financial results and industry trends to evaluate any shifts in sentiment or potential upside. Despite the bearish trend, the presence in a support zone may hint at a potential recovery, pending further market conditions.
Smart Data Insight
Master the Perfect Entry & Exit for this Stock
Don't leave your profits to chance. Historically, this stock follows specific seasonal patterns that institutional traders use to maximize returns.
- ✅ Identify the "Golden Buying Window"
- ✅ Avoid high-risk correction cycles
- ✅ Backtested data from the last 20+ years