June 10, 2026 a 06:44 am

COO: Fibonacci Analysis - The Cooper Companies, Inc.
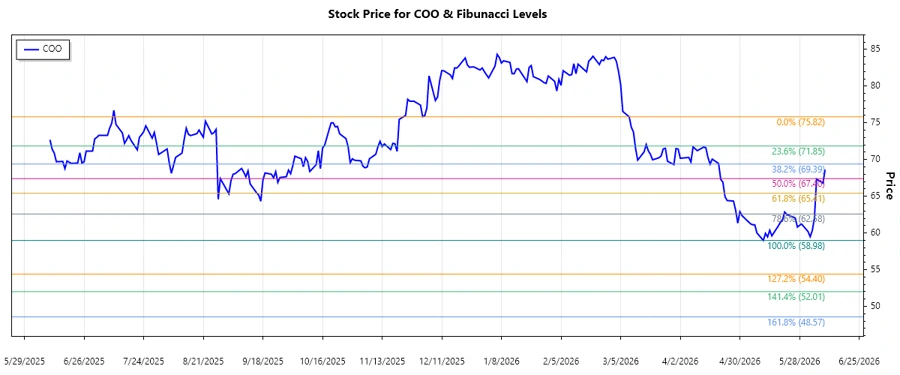
The Cooper Companies, Inc. (COO) has experienced fluctuations in its stock performance consistent with the trends observed in the global medical device sector. Recently, the stock showed a significant downward trend, providing a prime setup for technical analysis. The analysis of historical data reveals potential areas of support where market participants might show renewed interest in buying.
Fibonacci Analysis
| Detail | Information |
|---|---|
| Trend Start Date | 2026-03-09 |
| Trend End Date | 2026-06-09 |
| High Price | $75.82 (2026-03-09) |
| Low Price | $58.98 (2026-05-11) |
| Fibonacci Level 0.236 | $65.59 |
| Fibonacci Level 0.382 | $68.03 |
| Fibonacci Level 0.5 | $69.90 |
| Fibonacci Level 0.618 | $71.77 |
| Fibonacci Level 0.786 | $74.18 |
| Current Price | $68.62 |
| Retracement Zone | 0.382 |
| Technical Interpretation | Currently, the stock is in a retracement from its high, located within the 0.382 Fibonacci level. This could act as a point of potential support where purchasing interest may be reignited, suggesting a cautious approach for potential buyers. |
Conclusion
The Cooper Companies, Inc. presents a notable downward trend which could prove attractive for investors seeking entry at reduced prices relative to its previous highs. Technical signals suggest that the current price rests near a support level according to Fibonacci levels, offering a potential for price stabilization or reversal. However, should the support give way, further declines may be anticipated. Analysts must weigh the opportunity for purchasing against broader market conditions and company fundamentals. The stock's performance in near-term trading sessions will likely provide further insights into its trajectory.
Smart Data Insight
Master the Perfect Entry & Exit for this Stock
Don't leave your profits to chance. Historically, this stock follows specific seasonal patterns that institutional traders use to maximize returns.
- ✅ Identify the "Golden Buying Window"
- ✅ Avoid high-risk correction cycles
- ✅ Backtested data from the last 20+ years