September 30, 2025 a 06:45 am
COO: Fibonacci Analysis - The Cooper Companies, Inc.
The Cooper Companies, Inc. is a leading player in the healthcare sector, particularly in the field of contact lenses and women's health care products. In recent months, its stock price has shown a notable trend. By analyzing this trend using Fibonacci retracement, we can identify potential levels of support and resistance that may guide future pricing dynamics. Current market conditions and recent trends make this analysis timely for investors and analysts.
Fibonacci Analysis
| Data Point | Details |
|---|---|
| Start Date | 2024-10-01 |
| End Date | 2025-09-29 |
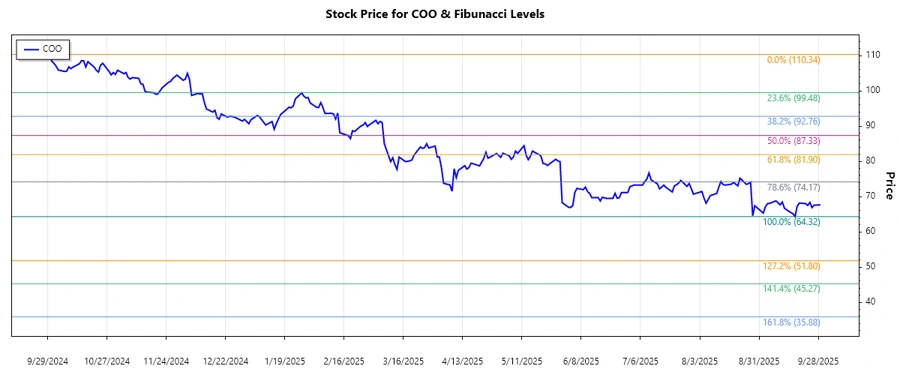
| Highest Point (Date) | 2024-09-30 (110.34) |
| Lowest Point (Date) | 2025-09-24 (64.32) |
| Fibonacci Levels |
0.236: $80.8 0.382: $74.92 0.5: $72.33 0.618: $69.74 0.786: $66.25 |
| Current Price | 67.67 |
| Retracement Zone | 0.786 |
| Technical Interpretation | Currently, the stock is trading within the 0.786 retracement level, suggesting a significant pullback from its highs. This level might act as a support, providing a potential bounce back. |
Conclusion
The Fibonacci analysis on The Cooper Companies, Inc. indicates that the stock is currently experiencing a pullback, trading close to the 0.786 retracement level. This could represent a critical support zone from which prices may rebound if buying interest increases. However, should the stock breach this level, it could indicate further downside risks. For analysts, these levels are crucial in assessing investor sentiment and guiding strategic decisions. Keeping an eye on macroeconomic factors and company-specific developments would be prudent to further inform potential trade actions.
Smart Data Insight
Master the Perfect Entry & Exit for this Stock
Don't leave your profits to chance. Historically, this stock follows specific seasonal patterns that institutional traders use to maximize returns.
- ✅ Identify the "Golden Buying Window"
- ✅ Avoid high-risk correction cycles
- ✅ Backtested data from the last 20+ years