June 19, 2025 a 03:31 pm
COO: Dividend Analysis - The Cooper Companies, Inc.
The Cooper Companies, Inc. presents itself as a notably stable company with a long history of maintaining its dividend. Despite its modest dividend yield, the company's long-term stability and low payout ratios suggest a robust potential for secure, if minor, dividend income. The lack of recent dividend growth may deter those seeking rapidly increasing income, but provides certainty to investors focused on steady, predictable returns. The last incidence of a dividend cut occurred back in 2008, highlighting a strong commitment to returning value to shareholders. The company operates within a sector known for resilience, supporting its continued stability.
📊 Overview
The Cooper Companies operates within a sector that typically protects against market volatility, contributing to consistent shareholder returns. Despite a relatively low dividend yield of 1.54%, its lengthy dividend history of 29 years underscores its reliability. The absence of a dividend cut or suspension since 2008 further emphasizes stability.
| Details | Attributes |
|---|---|
| Sector | Health Care |
| Dividend yield | 1.54% |
| Current dividend per share | 0.00 USD |
| Dividend history | 29 years |
| Last cut or suspension | 2008 |
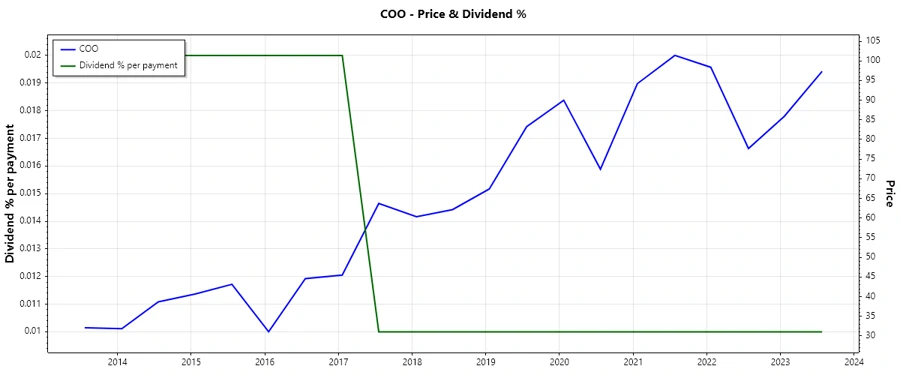
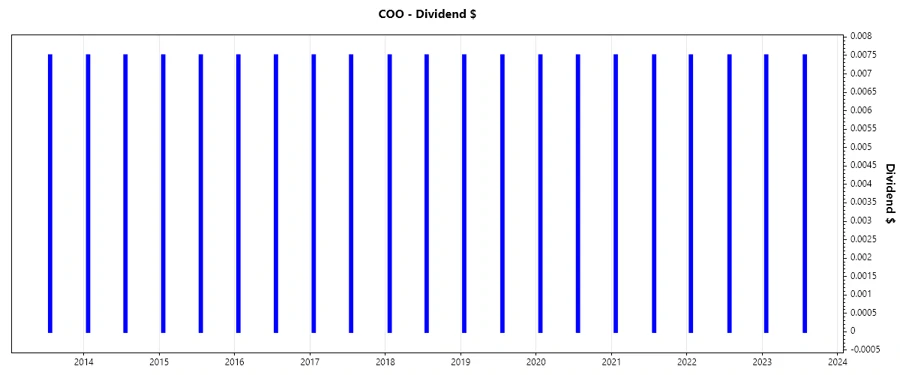
🗣️ Dividend History
With an unwavering dividend history, especially in turbulent market conditions, The Cooper Companies has cemented itself as a reliable dividend payer. Consistency over 29 years, despite minor adjustments, has underscored its commitment to financial reliability. This track record instills confidence among investors seeking safety and predictability.
| Year | Dividend per Share (USD) |
|---|---|
| 2023 | 0.0150 |
| 2022 | 0.0150 |
| 2021 | 0.0150 |
| 2020 | 0.0150 |
| 2019 | 0.0150 |
📈 Dividend Growth
In analyzing dividend growth, Cooper Companies displays zero growth both over 3 and 5 years. While this stagnation might seem uninspiring to growth-seeking investors, it highlights the firm's emphasis on maintaining consistent dividend payments rather than fluctuating policies. The average dividend growth of 0% over 5 years depicts a static yet determined approach to sustaining shareholder returns.
| Time | Growth |
|---|---|
| 3 years | 0% |
| 5 years | 0% |
📉 Payout Ratio
The payout ratios for The Cooper Companies are crucial for gauging the financial health and ability to maintain dividends. Payout ratios, calculated from both EPS and Free Cash Flow, stand at 0%. Such low ratios suggest significant headroom for the company to cover its dividends, pointing towards robust financial management and the potential for future growth or increased dividends.
| Key figure | Ratio |
|---|---|
| EPS-based | 0% |
| Free cash flow-based | 0% |
These figures denote minimal risk concerning dividend sustainability, enabling potential reinvestment into business growth or acquisitions.
✅ Cashflow & Capital Efficiency
| 2024 | 2023 | 2022 | |
|---|---|---|---|
| Free Cash Flow Yield | 1.38% | 1.39% | 3.34% |
| Earnings Yield | 1.88% | 1.91% | 2.86% |
| CAPEX to Operating Cash Flow | 59.38% | 64.61% | 34.95% |
| Stock-based Compensation to Revenue | 1.93% | 1.73% | 1.64% |
| Free Cash Flow / Operating Cash Flow Ratio | 40.62% | 35.39% | 65.05% |
The Cooper Companies demonstrates consistent cash flow management and capital allocation efficiency. The decline in recent Free Cash Flow Yield highlights room for improvement or potential strategic investments.
⚠️ Balance Sheet & Leverage Analysis
| 2024 | 2023 | 2022 | |
|---|---|---|---|
| Debt-to-Equity | 0.32 | 0.34 | 0.39 |
| Debt-to-Assets | 0.21 | 0.22 | 0.24 |
| Debt-to-Capital | 0.24 | 0.25 | 0.28 |
| Net Debt to EBITDA | 2.31 | 2.76 | 2.89 |
| Current Ratio | 0 | 1.76 | 1.20 |
| Quick Ratio | 1.12 | 1.00 | 0.71 |
| Financial Leverage | 1.52 | 1.54 | 1.60 |
The Cooper Companies' leverage ratios indicate manageable debt levels, with declining trends showcasing improved financial resilience.
✅ Fundamental Strength & Profitability
| 2024 | 2023 | 2022 | |
|---|---|---|---|
| Return on Equity | 4.85% | 3.90% | 5.38% |
| Return on Assets | 3.19% | 2.52% | 3.36% |
| Margins: Net | 10.07% | 8.19% | 11.66% |
| EBIT | 17.88% | 14.42% | 16.03% |
| EBITDA | 27.51% | 24.65% | 27.46% |
| Gross | 66.63% | 65.62% | 64.67% |
| R&D to Revenue | 3.98% | 3.82% | 3.33% |
The Cooper Companies displays moderate profitability with consistent margin maintenance. It's indicative of a strong market positioning, promoting future investment potential.
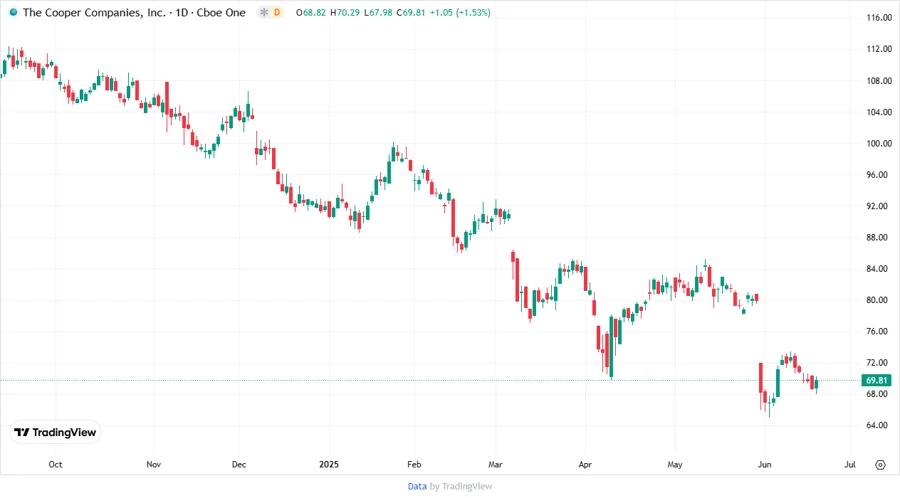
📈 Price Development
Dividend Scoring System
| Criteria | Score (1-5) | Score Bar |
|---|---|---|
| Dividend Yield | 2 | |
| Dividend Stability | 4 | |
| Dividend Growth | 1 | |
| Payout Ratio | 5 | |
| Financial Stability | 4 | |
| Dividend Continuity | 5 | |
| Cashflow Coverage | 3 | |
| Balance Sheet Quality | 4 |
Total Score: 28/40
Rating
Considering both the quantitative and qualitative data, The Cooper Companies, Inc. presents a strong, defensive investment opportunity with secure yet limited dividend yielding potential. The company's strategic financial management and historically stable dividends make it a prudent choice for risk-averse investors seeking to preserve capital while enjoying modest income. Future increases in dividend growth would enhance investment allure, corresponding with a favorable comprehensive recalibration of the yield structure.
Smart Data Insight
Master the Perfect Entry & Exit for this Stock
Don't leave your profits to chance. Historically, this stock follows specific seasonal patterns that institutional traders use to maximize returns.
- ✅ Identify the "Golden Buying Window"
- ✅ Avoid high-risk correction cycles
- ✅ Backtested data from the last 20+ years