November 24, 2025 a 03:15 am

COIN: Trend and Support & Resistance Analysis - Coinbase Global, Inc.
Coinbase Global, Inc. operates a robust platform for the cryptoeconomy, contributing essential financial and technological infrastructure. Its stock, reflecting the volatile yet promising crypto market, can experience both rapid surges and downturns. Monitoring its trends and support/resistance levels is crucial for investors aiming to capitalize on market movements.
Trend Analysis
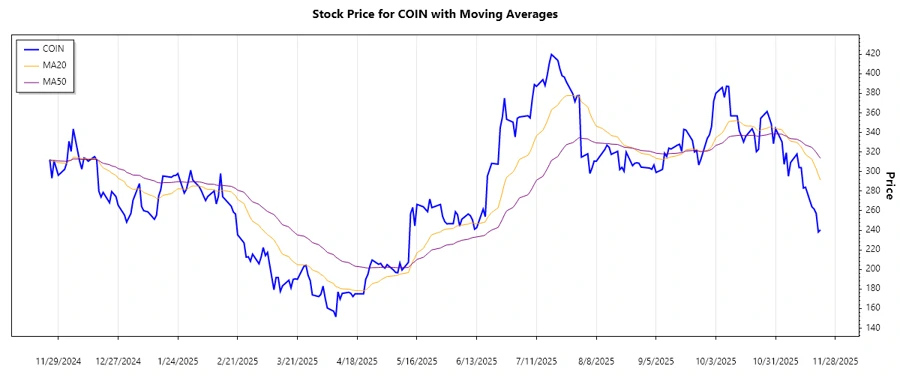
The trend analysis involves calculating the Exponential Moving Averages (EMA) over 20 and 50 days using recent closing prices. The comparison between EMA20 and EMA50 reveals:
| Date | Close Price | Trend |
|---|---|---|
| 2025-11-21 | $240.41 | ▼ Abwärtstrend |
| 2025-11-20 | $238.16 | ▼ Abwärtstrend |
| 2025-11-19 | $257.29 | ▼ Abwärtstrend |
| 2025-11-18 | $261.79 | ▼ Abwärtstrend |
| 2025-11-17 | $263.95 | ▼ Abwärtstrend |
| 2025-11-14 | $284.00 | ▼ Abwärtstrend |
| 2025-11-13 | $283.14 | ▼ Abwärtstrend |
Recent analysis indicates a continuous downtrend as EMA20 remains below EMA50. This implies selling pressure dominates currently.
Support and Resistance
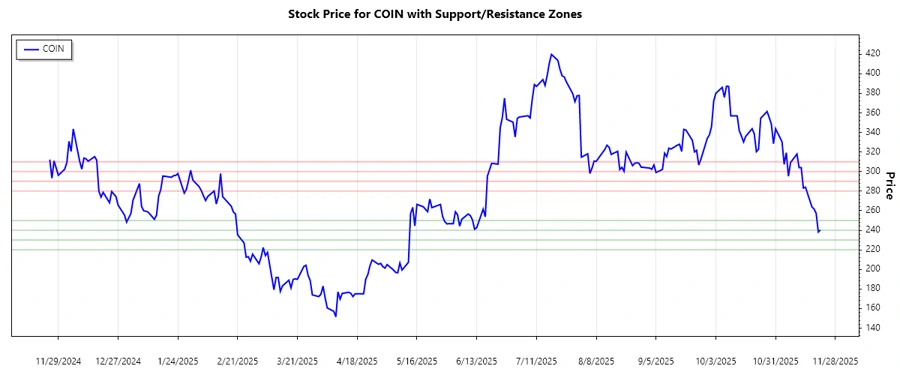
After analyzing historical prices, the support and resistance zones are identified as follows:
| Zone Type | From | To |
|---|---|---|
| Support 1 | ▲ $240 | ▲ $250 |
| Support 2 | ▲ $220 | ▲ $230 |
| Resistance 1 | ▼ $280 | ▼ $290 |
| Resistance 2 | ▼ $300 | ▼ $310 |
Currently, the stock price is hovering near the first support zone, suggesting a potential stabilization point or a risk of further decline.
Conclusion
The technical analysis of Coinbase Global, Inc. highlights a prevailing downtrend, with the price showing potential to test support levels. Investors should be cautious, recognizing that while the price might find respite at support zones, continued pressure could breach them. The evaluation of wider market sentiment, especially related to cryptocurrency trends, will be vital in anticipating future moves. Maintaining a keen eye on forex and market news that might affect crypto sentiment is prudent. Understanding these elements offers analysts insights into risk management and strategic positioning.
Smart Data Insight
Master the Perfect Entry & Exit for this Stock
Don't leave your profits to chance. Historically, this stock follows specific seasonal patterns that institutional traders use to maximize returns.
- ✅ Identify the "Golden Buying Window"
- ✅ Avoid high-risk correction cycles
- ✅ Backtested data from the last 20+ years