May 16, 2026 a 11:44 am
COIN: Fibonacci Analysis - Coinbase Global, Inc.
Coinbase Global, Inc., known for its prominent role in the cryptoeconomy, has experienced significant price movements over the past months. With the growing interest in cryptocurrencies, COIN has shown volatility, providing both opportunities and challenges for investors. Understanding its price trends through technical analysis, such as Fibonacci retracements, can offer valuable insights into potential future price movements and key support and resistance levels.
Fibonacci Analysis
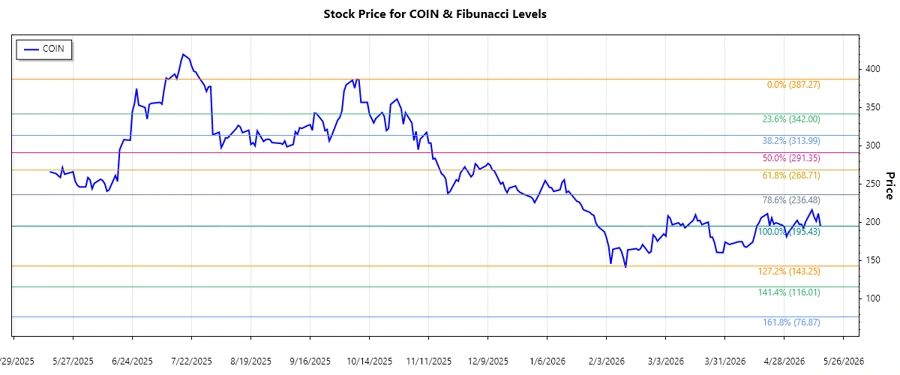
The data analysis of Coinbase Global, Inc. shows a dominant downtrend over the analyzed period. Identified from the highest price point on 2025-10-09 at $387.27 to the lowest on 2026-05-15 at $195.43, the trend provides crucial insights into the stock's performance.
| Start Date | End Date | High Price & Date | Low Price & Date |
|---|---|---|---|
| 2025-10-09 | 2026-05-15 | $387.27 (2025-10-09) | $195.43 (2026-05-15) |
Fibonacci Retracement Levels
| Level | Price |
|---|---|
| 0.236 | $246.41 |
| 0.382 | $278.79 |
| 0.5 | $291.35 |
| 0.618 | $303.91 |
| 0.786 | $328.66 |
As of the latest price $\195.43, the current position suggests that COIN is below the Fibonacci retracement levels, indicating it is entrenched firmly in its downtrend. This suggests that these levels may act as potential resistance if the price were to rally, but may also define future support if surpassed.
Conclusion
Evaluating the downward trajectory of Coinbase Global, Inc. through Fibonacci retracement analysis provides a framework for anticipating future price movements. Despite the current downturn, potential upsides may arise if the broader cryptoeconomy rebounds. Investors should be cautious and focus on the identified resistance levels for signs of trend reversals. Prudent trading requires monitoring external factors influencing cryptocurrencies, as these could sway COIN's performance significantly. Risks remain high in this volatile market segment, but opportunities may emerge, particularly for investors with a robust risk management plan.
Smart Data Insight
Master the Perfect Entry & Exit for this Stock
Don't leave your profits to chance. Historically, this stock follows specific seasonal patterns that institutional traders use to maximize returns.
- ✅ Identify the "Golden Buying Window"
- ✅ Avoid high-risk correction cycles
- ✅ Backtested data from the last 20+ years