March 21, 2026 a 06:44 am
COIN: Fibonacci Analysis - Coinbase Global, Inc.
Coinbase Global, Inc. has experienced significant volatility, largely driven by the broader movements in the cryptoeconomy. As a leading platform in financial infrastructure for crypto assets, its performance is closely tied to crypto market dynamics. With recent trends showing signs of stabilization, Coinbase's stock could provide both opportunities and risks for investors looking for exposure to the crypto sector. Monitoring Fibonacci retracement levels can offer insights into potential support and resistance points for traders.
Fibonacci Analysis
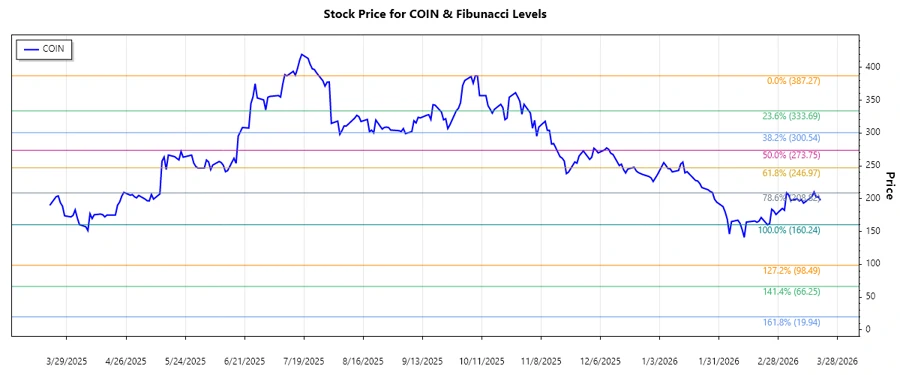
The recent trend for Coinbase Global, Inc. (COIN) has been a downward movement, where prices have declined from a peak. The technical analysis reveals significant retracement levels that may indicate future support or resistance.
| Aspect | Details |
|---|---|
| Trend Start Date | 2025-10-09 |
| Trend End Date | 2026-03-20 |
| High Point | 387.27 on 2025-10-09 |
| Low Point | 160.24 on 2026-02-23 |
Fibonacci Levels
| Level | Price |
|---|---|
| 0.236 | 239.65 |
| 0.382 | 272.14 |
| 0.5 | 298.76 |
| 0.618 | 325.38 |
| 0.786 | 363.53 |
The current price hovers around 197.5, indicating it is within the retracement zone. Specifically, it's far below the 0.236 level, pointing to a possible strong resistance around 239.65. This suggests potential difficulties for bulls unless strong buying materializes.
Conclusion
Coinbase Global, Inc. presents a complex case for technical analysis with its recent downtrend. The stock's close tie to cryptocurrency trends implies higher market sensitivity. Trading near the lower end of Fibonacci retracement levels highlights potential for volatility, with risks in further declines if support is breached. Conversely, a sustained climb above critical retracement levels could denote a bullish reversal sign, offering room for price recovery. Investors and traders should remain vigilant to broader crypto market cues. In summary, while opportunities exist, caution should be exercised given the financial instrument's inherent volatility.