March 23, 2026 a 09:03 am
COF: Trend and Support & Resistance Analysis - Capital One Financial Corporation
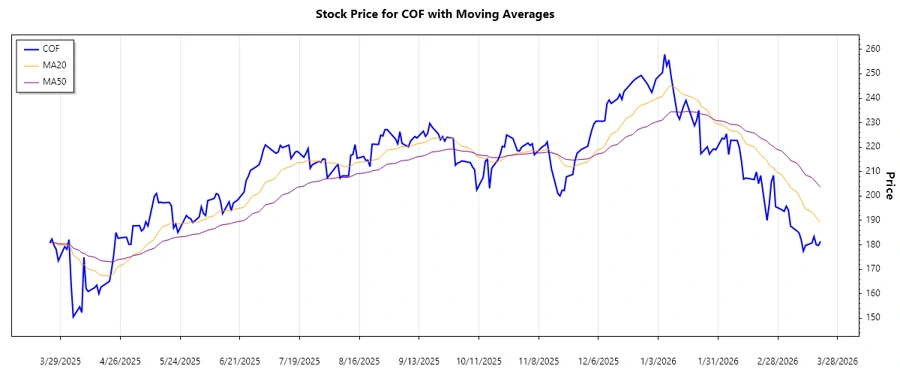
Capital One Financial Corporation's recent stock performance indicates a notable trend analysis opportunity. Over the past months, the stock has experienced fluctuations influenced by broader market conditions and internal financial performances. Investors should carefully consider technical indicators, including moving averages, to effectively navigate current trends and potential support and resistance zones.
Trend Analysis
Analyzing the stock's recent performance using EMA indicators reveals a prevailing trend that investors should be aware of.
| Date | Schlusskurs | Trend |
|---|---|---|
| 2026-03-20 | $181.46 | ▼ Abwärtstrend |
| 2026-03-19 | $179.73 | ▼ Abwärtstrend |
| 2026-03-18 | $180.14 | ⚖️ Seitwärtstrend |
| 2026-03-17 | $183.42 | ▲ Aufwärtstrend |
| 2026-03-16 | $180.77 | ▲ Aufwärtstrend |
| 2026-03-13 | $179.79 | ▼ Abwärtstrend |
| 2026-03-12 | $177.45 | ▼ Abwärtstrend |
The current market exhibits a slight downward tendency, which could suggest potential entry points for investors looking for lower risk opportunities amidst short-term fluctuations.
Support and Resistance
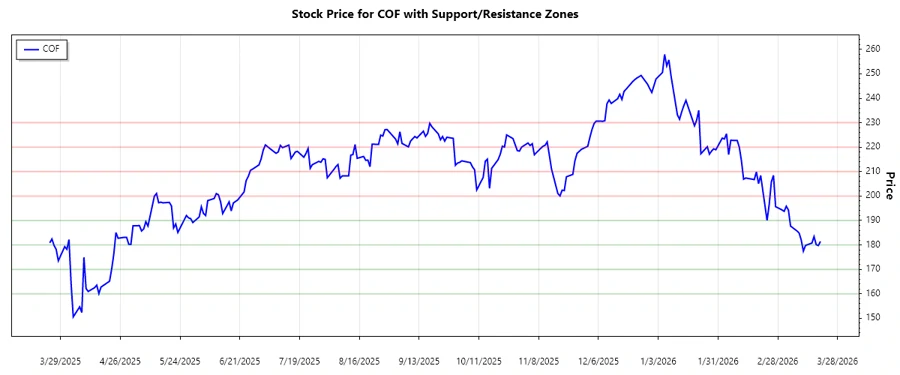
Identifying key support and resistance levels is crucial for understanding potential reversal points in the stock's future movements.
| Type | Zone from | Zone to |
|---|---|---|
| Support Zone 1 | ▼ $160 | ▼ $170 |
| Support Zone 2 | ▼ $180 | ▼ $190 |
| Resistance Zone 1 | ▲ $200 | ▲ $210 |
| Resistance Zone 2 | ▲ $220 | ▲ $230 |
The current stock price resides near a key support level, suggesting a critical point for potential price recovery or further decline.
Conclusion
Capital One Financial Corporation’s stock presents both opportunities and risks. The current downward trend could appeal to some investors awaiting potential long-term growth after reaching significant support levels. However, breaking past resistance zones is crucial to confirm upward momentum. Technical analysis tools, paired with market conditions, should guide investment decisions to maximize potential gains while mitigating risks.