November 14, 2025 a 01:15 pm
COF: Trend and Support & Resistance Analysis - Capital One Financial Corporation
The recent analysis of Capital One Financial Corporation shows significant price movements over the last months, with the potential for further fluctuations. The technical indicators suggest a near-term trend direction and critical support and resistance levels. With increasing adoption of digital channels, Capital One's strategic focus remains pivotal in its growth trajectory.
Trend Analysis
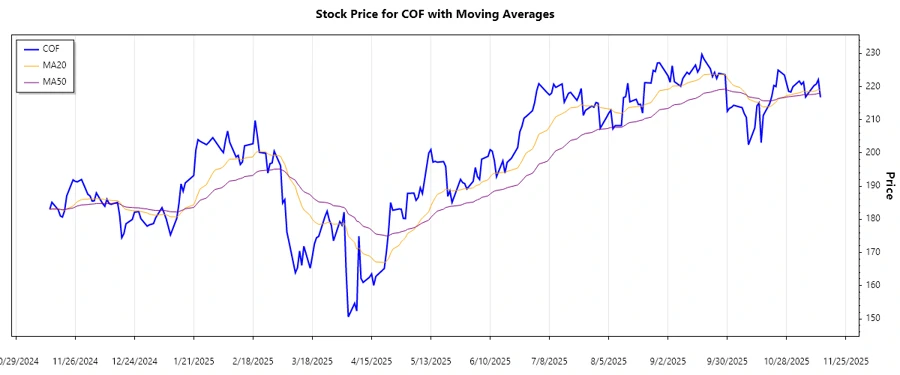
The analysis of Capital One's stock over the past months highlights a fluctuating price trend. Calculating the Exponential Moving Averages (EMA), the 20-day EMA and 50-day EMA can give insights into the prevailing trend. Based on these, the stock currently exhibits a ▼ downtrend.
| Date | Close Price | Trend Direction |
|---|---|---|
| 2025-11-13 | 216.80 | ▼ |
| 2025-11-12 | 222.13 | ▲ |
| 2025-11-11 | 220.75 | ▼ |
| 2025-11-10 | 220.36 | ▼ |
| 2025-11-07 | 217.82 | ▼ |
| 2025-11-06 | 216.88 | ▼ |
| 2025-11-05 | 221.40 | ▲ |
This exhibits a persistent downward momentum with intermittent recoveries suggesting high volatility and a bearish outlook.
Support and Resistance
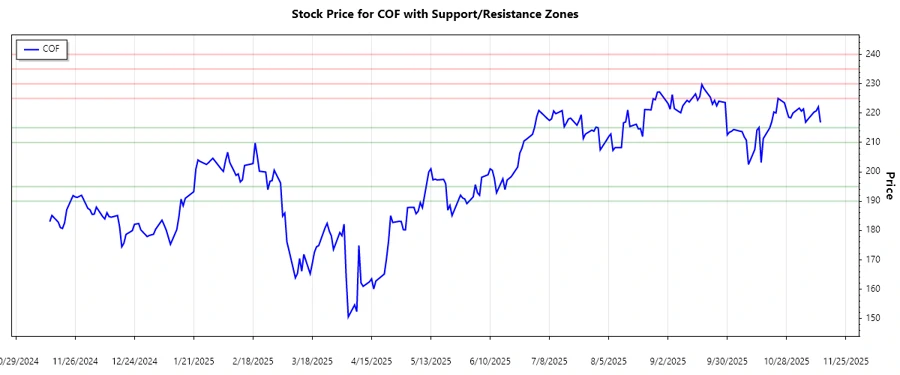
Analyzing the historical price patterns, two key support and resistance zones emerge. These areas are essential to assess potential price reversal points in the future.
| Zone Type | From | To |
|---|---|---|
| Support | 210.00 | 215.00 |
| Support | 190.00 | 195.00 |
| Resistance | 225.00 | 230.00 |
| Resistance | 235.00 | 240.00 |
The stock's current price is within a support zone, which may act as a foundation for a potential upward bounce if market conditions improve.
Conclusion
An analysis of Capital One’s financial data suggests a cautious stance for investors given the existing downtrend and proximity to key support levels. While potential exists for recovery, the surrounding market and economic factors can play a significant role. The outlined levels provide reference points for traders to strategize their entry and exit decisions. Monitoring market news and developments could offer further insights into this financial landscape.
Smart Data Insight
Master the Perfect Entry & Exit for this Stock
Don't leave your profits to chance. Historically, this stock follows specific seasonal patterns that institutional traders use to maximize returns.
- ✅ Identify the "Golden Buying Window"
- ✅ Avoid high-risk correction cycles
- ✅ Backtested data from the last 20+ years