
June 19, 2026 a 05:15 am
COF: Fibonacci Analysis - Capital One Financial Corporation
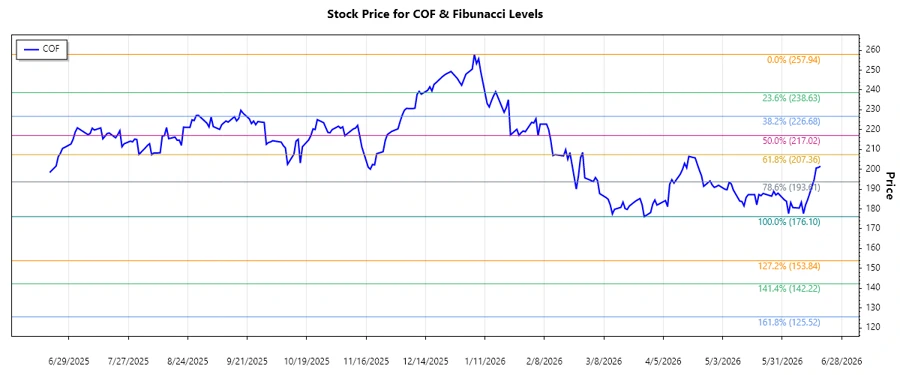
The stock of Capital One Financial Corporation (COF) has shown notable volatility in recent months, reflecting the dynamic financial environment. As a leading financial institution, Capital One benefits from a diversified revenue stream, yet it faces challenges in adapting to regulatory changes and consumer preferences. The examination of its stock price trend and application of Fibonacci retracement levels can provide insights into potential support and resistance zones.
Fibonacci Analysis
| Analysis Data | Details |
|---|---|
| Start Date | 2026-01-09 |
| End Date | 2026-06-18 |
| High Price (Date) | $257.94 (2026-01-06) |
| Low Price (Date) | $176.10 (2026-03-27) |
| Fibonacci Levels |
|
| Current Price Retracement Zone | 0.236 |
| Technical Interpretation | The current price is in the early retracement zone (0.236), indicating a potential first level of resistance. A move beyond this level could lead to higher resistance zones. |
Conclusion
The technical analysis of Capital One Financial Corporation (COF) using Fibonacci retracement levels suggests the stock is in a recovery phase from a significant downtrend. While there is potential for further growth as the stock approaches key retracement levels, caution is advised as the market remains highly volatile. A breach of higher Fibonacci levels could signal stronger bullish sentiment. However, investors should remain aware of broader economic factors and company-specific news, which could impact future performance. Given these variables, COF presents both opportunities and risks, providing astute investors with a chance to capitalize on its current market position.
Smart Data Insight
Master the Perfect Entry & Exit for this Stock
Don't leave your profits to chance. Historically, this stock follows specific seasonal patterns that institutional traders use to maximize returns.
- ✅ Identify the "Golden Buying Window"
- ✅ Avoid high-risk correction cycles
- ✅ Backtested data from the last 20+ years