March 06, 2026 a 10:15 am
COF: Fibonacci Analysis - Capital One Financial Corporation
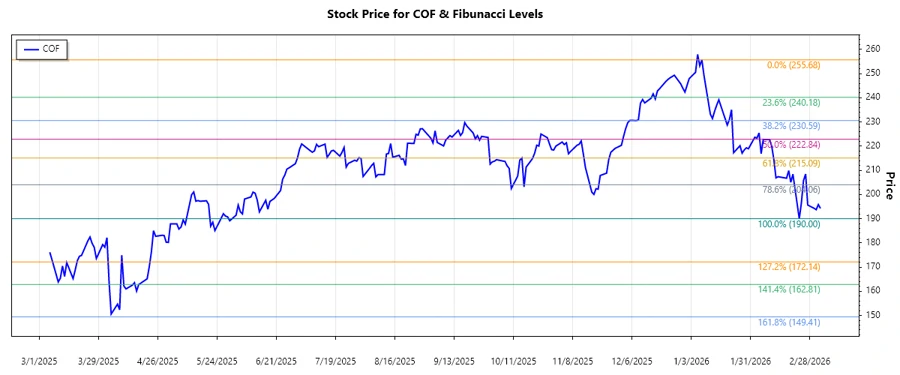
The analysis of Capital One Financial Corporation's stock reveals notable movements in recent months. With a diverse range of financial services offered across various regions, COF has presented dynamic trends significant for investors. Recent data suggests a downward trend, highlighting potential retracement levels that investors should be aware of.
Fibonacci Analysis
The analysis of Capital One Financial Corporation's (COF) stock indicates a dominant downward trend from January 8, 2025, to February 24, 2026. This period saw a decrease from a high of $255.68 on January 8, 2025, to a low of $190 on February 23, 2026, creating opportunities to evaluate potential retracement levels.
| Detail | Value |
|---|---|
| Start Date | 2025-01-08 |
| End Date | 2026-02-23 |
| High Point | $255.68 on 2025-01-08 |
| Low Point | $190.00 on 2026-02-23 |
| 0.236 Level | $205.91 |
| 0.382 Level | $215.04 |
| 0.5 Level | $222.84 |
| 0.618 Level | $230.64 |
| 0.786 Level | $241.33 |
| Current Price | $194.27 |
| Current Retracement Zone | none |
| Interpretation | The current price is outside Fibonacci retracement levels and suggests potential resistance or the beginning of stabilization. |
Conclusion
Capital One Financial Corporation (COF) has experienced a downward trend, which has impacted its stock value significantly. The identified Fibonacci levels provide potential zones where price support or resistance may occur, offering guidance for investors. While the current price lies outside defined retracement zones, suggesting potential pressure or the onset of a base, investors should approach with both caution and strategic planning to leverage emerging opportunities.