November 04, 2025 a 05:15 am

COF: Fibonacci Analysis - Capital One Financial Corporation
Capital One Financial Corporation has exhibited significant growth over the past few months, particularly in the credit and banking sector which it operates. The recent uptrend in stock performance underscores the company's ability to adapt to dynamic market conditions, inclusive of its digital banking expansion. As investors watch closely, continuation of this trend could affirm the potential for increased returns.
Fibonacci Analysis
| Description | Details |
|---|---|
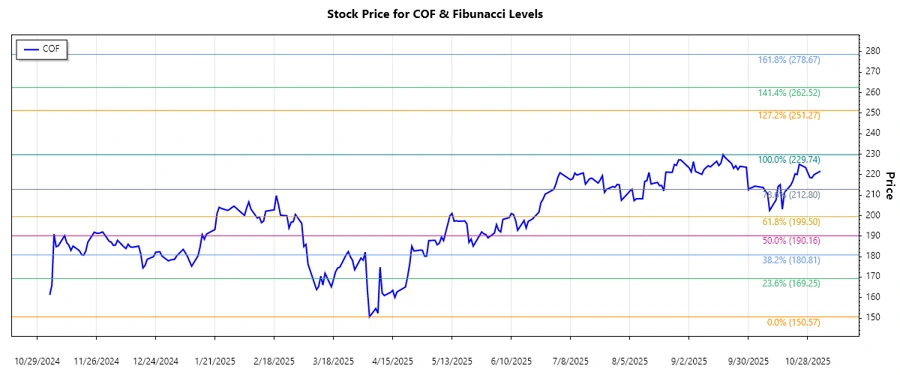
| Trend Period | 2025-04-02 to 2025-11-03 |
| High Price & Date | $229.74 on 2025-09-18 |
| Low Price & Date | $150.57 on 2025-04-04 |
| Fibonacci Levels |
|
| Current Price & Retracement Zone | $221.7, currently in the 0.786 retracement zone |
| Technical Interpretation | The current price suggests testing of the 0.786 Fibonacci retracement level, potentially indicating a strong resistance point. If the stock breaches this level upwards, it could signify a continued uptrend. |
Conclusion
Capital One Financial Corporation has demonstrated a substantial recovery and robust performance in recent months, reflective of its strategic initiatives and market adaptability. The stock currently trades near a critical Fibonacci level, indicating potential volatility. A move past the current resistance might signify prolonged bullish momentum, yet caution is advised as retracement levels also present reversal risks. Analysts should closely monitor market reactions and financial disclosures to gauge future trends accurately.
Smart Data Insight
Master the Perfect Entry & Exit for this Stock
Don't leave your profits to chance. Historically, this stock follows specific seasonal patterns that institutional traders use to maximize returns.
- ✅ Identify the "Golden Buying Window"
- ✅ Avoid high-risk correction cycles
- ✅ Backtested data from the last 20+ years