
August 28, 2025 a 03:16 pm
COF: Fibonacci Analysis - Capital One Financial Corporation
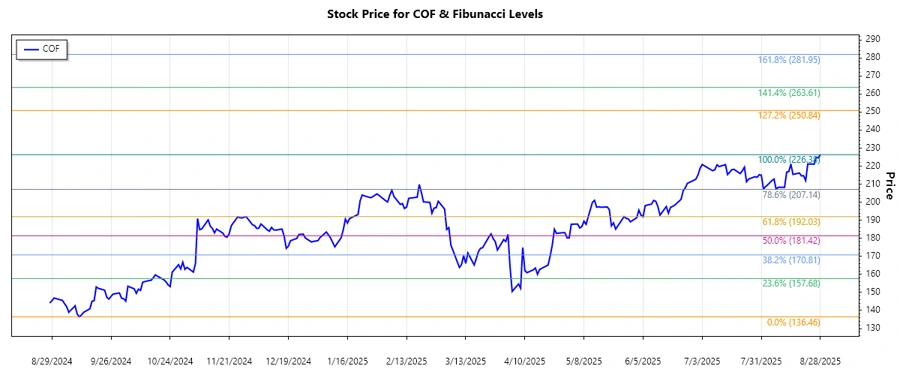
Capital One Financial Corporation's stock has shown significant bullish momentum over the past months, demonstrating robust financial performance and strategic positioning across its key market segments. The company's diverse operations in the credit card, consumer banking, and commercial banking sectors continue to lead to a strong financial standing. Given the recent uptrend, technical indicators suggest potential for continued growth, although investors should watch key retracement levels closely.
Fibonacci Analysis
| Trend Details | Data |
|---|---|
| Start Date | 2024-09-11 |
| End Date | 2025-08-28 |
| High Price | $226.38 on 2025-08-28 |
| Low Price | $136.46 on 2024-09-11 |
Fibonacci Retracement Levels
| Level | Price |
|---|---|
| 0.236 | $188.48 |
| 0.382 | $198.34 |
| 0.5 | $206.42 |
| 0.618 | $214.50 |
| 0.786 | $224.47 |
The current price of Capital One Financial Corporation is above the 0.786 retracement level, suggesting it is maintaining a strong position well above prior resistance levels. This indicates a bullish outlook where such retracement levels now act as support.
Technical analysis suggests a potential continuation of the current uptrend, with retracement levels providing key support zones to monitor for potential buying opportunities.
Conclusion
The Capital One Financial Corporation stock shows optimistic potential considering the ongoing uptrend and strategic financial decisions in their credit card and banking operations. The calculated Fibonacci levels offer investors valuable insights into potential support and resistance zones. While the stock maintains a positive trend, caution remains essential in volatile markets. Key technical supports could offer entry points, but industry and economic factors should also be considered. Overall, COF remains an attractive choice for those seeking exposure in the financial sector.
Smart Data Insight
Master the Perfect Entry & Exit for this Stock
Don't leave your profits to chance. Historically, this stock follows specific seasonal patterns that institutional traders use to maximize returns.
- ✅ Identify the "Golden Buying Window"
- ✅ Avoid high-risk correction cycles
- ✅ Backtested data from the last 20+ years