June 21, 2026 a 12:46 pm


COF: Dividend Analysis - Capital One Financial Corporation
Capital One Financial Corporation, with its robust history of dividend disbursement, stands out as a stable choice for income-focused investors. The company maintains a competitive dividend yield and has historically sustained its dividend payouts without significant cuts. Despite economic fluctuations, Capital One has managed to uphold an impressive dividend record, making it an attractive proposition for dividend-seeking portfolios.
💼 Overview
The stability in Capital One's dividend policy is reflective of its sector's overall resilience. With a dividend yield of 1.65%, the stock offers a moderate income stream. Coupled with a long track of continuous payouts over 32 years, it underscores the company's commitment to returning value to its shareholders. Below is a table summarizing key dividend-related metrics:
| Attribute | Details |
|---|---|
| Sector | Financial Services |
| Dividend Yield | 1.65% |
| Current Dividend Per Share | $3.27 |
| Dividend History | 32 years |
| Last Cut or Suspension | None |
📜 Dividend History
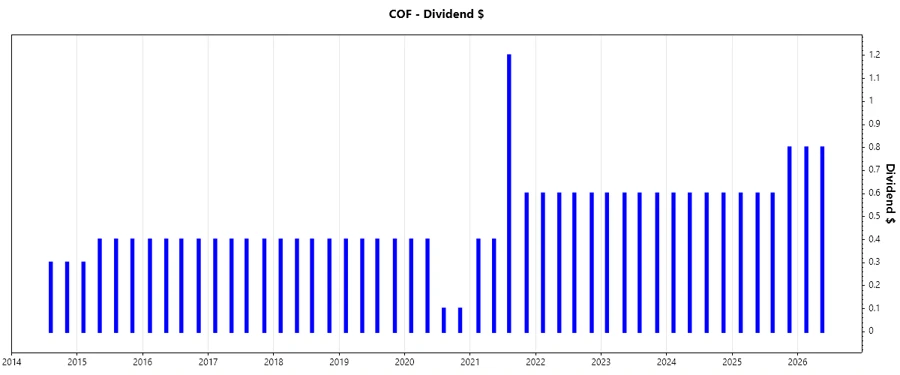
The long and consistent dividend history of Capital One highlights the company's ability to generate stable cash flows through various market cycles. This track record is critical for assessing the reliability of future dividend payouts. The image below depicts stock performance alongside dividend distributions.
| Year | Dividend Per Share (USD) |
|---|---|
| 2026 | 1.60 |
| 2025 | 2.60 |
| 2024 | 2.40 |
| 2023 | 2.40 |
| 2022 | 2.40 |
📈 Dividend Growth
Dividend growth is a key indicator of a company's potential for long-term income appreciation. For Capital One, the modest growth rate over both 3 and 5 years shows a steady improvement in dividend payouts, providing investors with increasing cash returns over time. Below, we observe the growth percentages:
| Time | Growth |
|---|---|
| 3 years | 2.7% |
| 5 years | 21.1% |
The average dividend growth is 21.1% over 5 years. This shows moderate but steady dividend growth.
🧮 Payout Ratio
Payout ratios provide insight into how well a company can sustain its dividends. They reflect the proportion of earnings paid out as dividends to shareholders, indicating financial flexibility and sustainability of dividends.
| Key Figure | Ratio |
|---|---|
| EPS-based | 63.15% |
| Free Cash Flow-based | 7.05% |
The relatively high EPS payout ratio of 63.15% suggests the company distributes a considerable portion of its profits but maintains substantial flexibility in its cash flow-based ratio, only at 7.05%.
🔄 Cashflow & Capital Efficiency
Being critical indicators of long-term financial health and operational efficiency, cash flow metrics provide insights into Capital One's capital usage effectiveness and overall liquidity.
| Year | 2025 | 2024 | 2023 |
|---|---|---|---|
| Free Cash Flow Yield | 19.95% | 24.85% | 39.12% |
| Earnings Yield | 1.87% | 6.96% | 9.75% |
| CAPEX to Operating Cash Flow | 5.69% | 6.63% | 4.67% |
| Stock-based Compensation to Revenue | 1.12% | 1.05% | 1.04% |
| Free Cash Flow / Operating Cash Flow Ratio | 94.31% | 93.37% | 95.33% |
Capital One's strong cash flow ratios and calculated capital allocations indicate effective management in maintaining its operating efficiency and liquidity.
📊 Balance Sheet & Leverage Analysis
Analyzing the balance sheet and leverage ratios is vital for maintaining a clear picture of debt management, financial stability, and overall fiscal health.
| Year | 2025 | 2024 | 2023 |
|---|---|---|---|
| Debt-to-Equity | 0.45 | 0.75 | 0.86 |
| Debt-to-Assets | 0.08 | 0.09 | 0.10 |
| Debt-to-Capital | 0.31 | 0.43 | 0.46 |
| Net Debt to EBITDA | -2.82 | 0.25 | 0.71 |
| Current Ratio | 0.15 | 0.14 | 0.36 |
| Quick Ratio | 0.15 | 0.14 | 0.36 |
| Financial Leverage | 5.89 | 8.06 | 8.24 |
Given the manageable debt levels and leveraging ratios, Capital One exhibits a steady financial grounding and prudent debt utilization practices.
🏦 Fundamental Strength & Profitability
Return metrics, alongside profit margin analysis, provide insights into the efficiency of operations and capital, thereby forecasting potential investment returns.
| Year | 2025 | 2024 | 2023 |
|---|---|---|---|
| Return on Equity | 2.16% | 7.81% | 8.41% |
| Return on Assets | 0.37% | 0.97% | 1.02% |
| Net Margin | 3.54% | 8.81% | 9.88% |
| EBIT Margin | 3.29% | 10.96% | 12.22% |
| EBITDA Margin | 10.89% | 16.96% | 18.73% |
| Gross Margin | 47.33% | 50.79% | 53.27% |
| R&D to Revenue | 0% | 0% | 0% |
With improving return percentages and robust margins, Capital One demonstrates a commendable ability to allocate resources efficiently, enhancing profitability for its investors.
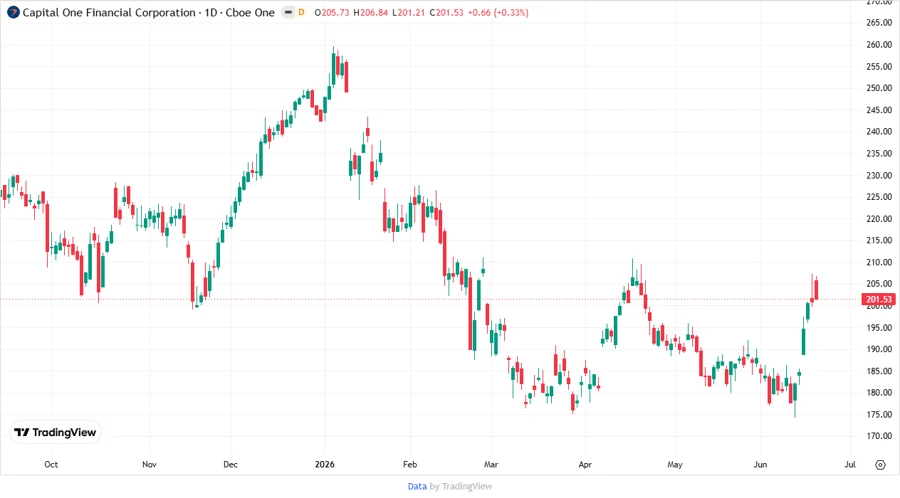
📉 Price Development
📊 Dividend Scoring System
| Criteria | Score | Score Bar |
|---|---|---|
| Dividend Yield | 3 | |
| Dividend Stability | 5 | |
| Dividend Growth | 4 | |
| Payout Ratio | 3 | |
| Financial Stability | 4 | |
| Dividend Continuity | 5 | |
| Cashflow Coverage | 5 | |
| Balance Sheet Quality | 4 |
Total Score: 33/40
Rating
Capital One Financial Corporation presents a robust dividend profile backed by a strong history and consistent performance. While the yield might not be the highest in the sector, the stability and steady growth of dividends, along with solid financial fundamentals, make it a recommended option for investors seeking stable income with moderate growth potential.
Smart Data Insight
Master the Perfect Entry & Exit for this Stock
Don't leave your profits to chance. Historically, this stock follows specific seasonal patterns that institutional traders use to maximize returns.
- ✅ Identify the "Golden Buying Window"
- ✅ Avoid high-risk correction cycles
- ✅ Backtested data from the last 20+ years