July 24, 2025 a 03:31 pm

COF: Dividend Analysis - Capital One Financial Corporation
Capital One Financial Corporation presents a mixed dividend profile with a 1.30% yield and consistent 31-year history. However, investors should note the recent decrease in dividend growth over three years. The payout ratios and financial metrics warrant attention for sustainable investment decisions.
📊 Overview
| Metric | Details |
|---|---|
| Sector | Financial |
| Dividend Yield | 1.30% |
| Current Dividend Per Share | 3.03 USD |
| Dividend History | 31 years |
| Last Cut/Suspension | None |
🗣️ Dividend History
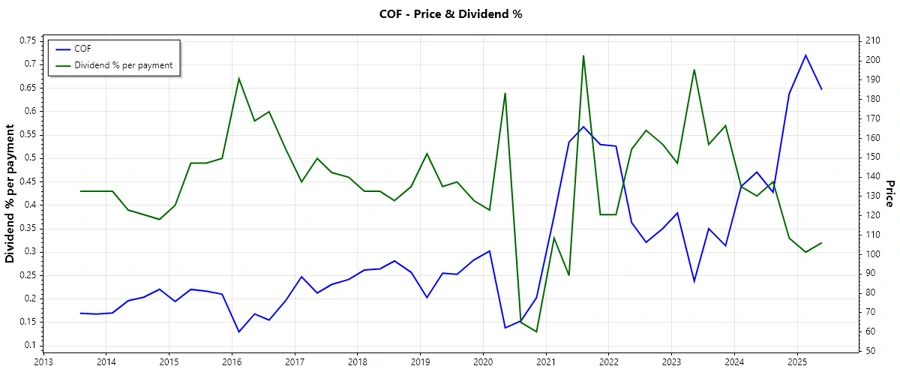
The historic consistency of Capital One's dividend payments over 31 years is noteworthy for long-term stability and investor reassurance. Although recent years showed stability with periodic raises, strategic changes might be needed for competitive positioning.
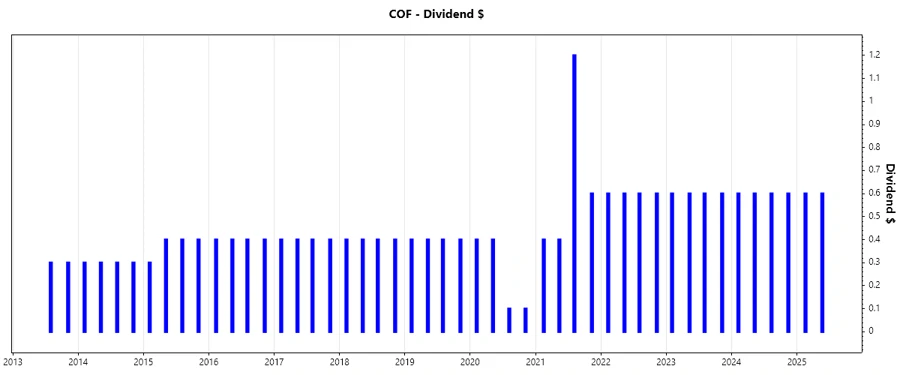
| Year | Dividend Per Share (USD) |
|---|---|
| 2025 | 1.2 |
| 2024 | 2.4 |
| 2023 | 2.4 |
| 2022 | 2.4 |
| 2021 | 2.6 |
📈 Dividend Growth
Assessing past three and five-year growth metrics is essential for evaluating future dividend potential. Despite a minor 5-year rise of 8.45%, recent trends raise concerns for aggressive growth forecasts.
| Time | Growth |
|---|---|
| 3 years | -2.63% |
| 5 years | 8.45% |
The average dividend growth is 8.45% over 5 years. This shows moderate but steady dividend growth.
⚠️ Payout Ratio
Payout ratios indicate potential overextension; EPS-based payout is notably high at 106.95%, suggesting earnings coverage may need reassessment. The lower FCF-based ratio of 10.48% highlights divergent financial dynamics within the company.
| Key figure | Ratio |
|---|---|
| EPS-based | 106.95% |
| Free cash flow-based | 10.48% |
The high EPS payout ratio suggests possible strain on earnings sustainability, while the FCF ratio is more conservative.
✅ Cashflow & Capital Efficiency
Cashflow metrics signify company operational health. Positive yields affirm efficiency, while a high ratio of free cash flow to operating cash flow underlines liquidity robustness.
| Year | 2024 | 2023 | 2022 |
|---|---|---|---|
| Free Cash Flow Yield | 24.85% | 39.12% | 33.70% |
| Earnings Yield | 6.96% | 9.75% | 19.27% |
| CAPEX to Operating Cash Flow | 6.63% | 4.67% | 6.76% |
| Stock-based Compensation to Revenue | 1.05% | 1.39% | 1.11% |
| Free Cash Flow / Operating Cash Flow Ratio | 93.37% | 95.33% | 93.24% |
Overall, cash flow metrics reflect proficient financial management, underpinning solid capital efficiency.
💼 Balance Sheet & Leverage Analysis
Debt metrics hint at standard industry leverage. Keeping a balanced debt-to-equity ratio is key for maintaining investor trust.
| Year | 2024 | 2023 | 2022 |
|---|---|---|---|
| Debt-to-Equity | 0.75 | 0.85 | 0.91 |
| Debt-to-Assets | 0.09 | 0.10 | 0.11 |
| Debt-to-Capital | 0.43 | 0.46 | 0.48 |
| Net Debt to EBITDA | 0.25 | 0.65 | 1.36 |
| Current Ratio | 0.14 | 5.69 | 62.54 |
| Quick Ratio | 0.14 | 5.69 | 62.54 |
| Financial Leverage | 8.06 | 8.24 | 8.66 |
Capital One Financial Corporation's balance sheet highlights moderate leverage, suggesting controlled debt exposure.
🏦 Fundamental Strength & Profitability
The profitability indicators provide insight into the company's efficiency in utilizing assets to generate earnings, a fundamental aspect of long-term financial health.
| Year | 2024 | 2023 | 2022 |
|---|---|---|---|
| Return on Equity | 7.81% | 8.41% | 13.99% |
| Return on Assets | 0.97% | 1.02% | 1.62% |
| Margins: Net | 8.81% | 13.28% | 25.91% |
| Margins: EBIT | 10.96% | 16.43% | 32.53% |
| Margins: EBITDA | 16.96% | 25.20% | 43.83% |
| Margins: Gross | 50.79% | 70.05% | 100.00% |
| Research & Development to Revenue | 0% | 0% | 0% |
Profit margins are solid overall, demonstrating effective cost control and operational success.
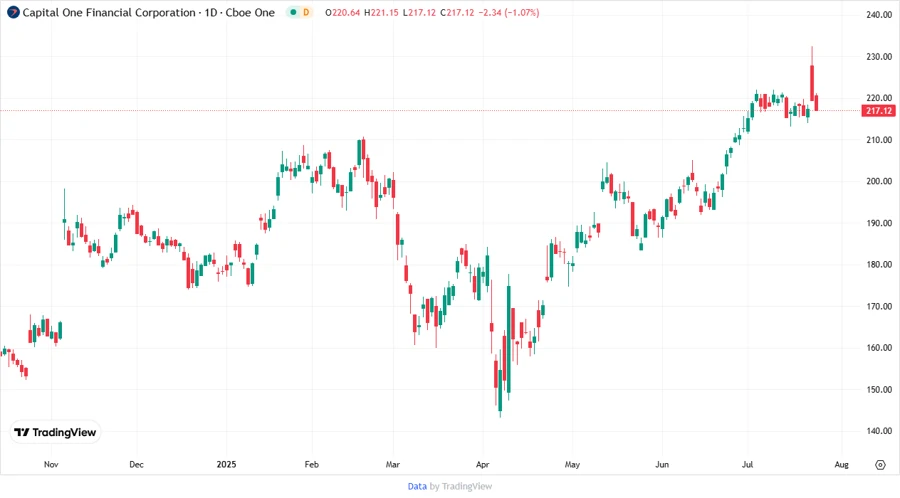
📉 Price Development
✅ Dividend Scoring System
| Criteria | Score | Visual |
|---|---|---|
| Dividend Yield | 2 | |
| Dividend Stability | 4 | |
| Dividend Growth | 3 | |
| Payout Ratio | 2 | |
| Financial Stability | 3 | |
| Dividend Continuity | 5 | |
| Cashflow Coverage | 4 | |
| Balance Sheet Quality | 3 |
Total Score: 26/40
🎯 Rating
Capital One Financial Corporation's dividend profile presents a moderate yet consistent history, offset by constrained recent growth. Investors should weigh the high payout ratio against strong cash flows and operational strategy before pursuing dividend-focused positions.
Smart Data Insight
Master the Perfect Entry & Exit for this Stock
Don't leave your profits to chance. Historically, this stock follows specific seasonal patterns that institutional traders use to maximize returns.
- ✅ Identify the "Golden Buying Window"
- ✅ Avoid high-risk correction cycles
- ✅ Backtested data from the last 20+ years