April 19, 2026 a 07:31 am

CNP: Dividend Analysis - CenterPoint Energy, Inc.
CenterPoint Energy, Inc. presents a formidable presence in the utility sector with a demonstrated history of stable and rising dividends. With an impressive dividend history spanning 57 years, the company underscores a strong commitment to shareholder returns. Its current dividend profile, combined with a prudent payout strategy, renders it an appealing consideration for income-focused investors.
📊 Overview
CenterPoint Energy serves as a resilient choice within the utility sector. The following key metrics highlight its strong dividend profile:
| Metric | Value |
|---|---|
| Sector | Utilities |
| Dividend Yield | 2.09% |
| Current Dividend per Share | $0.88 USD |
| Dividend History | 57 years |
| Last Cut or Suspension | None |
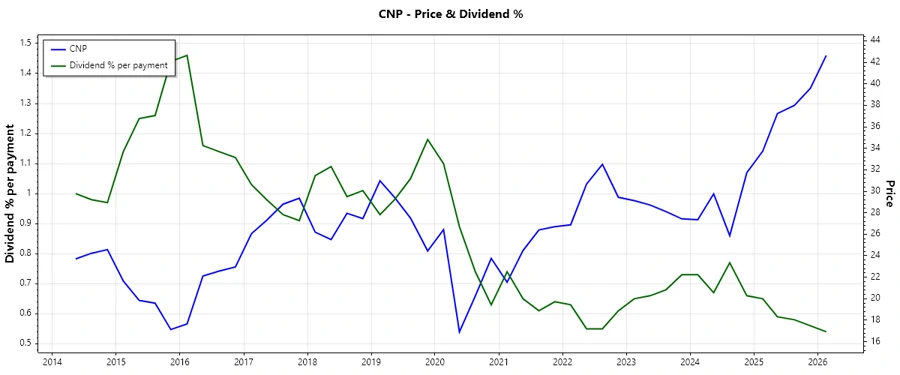
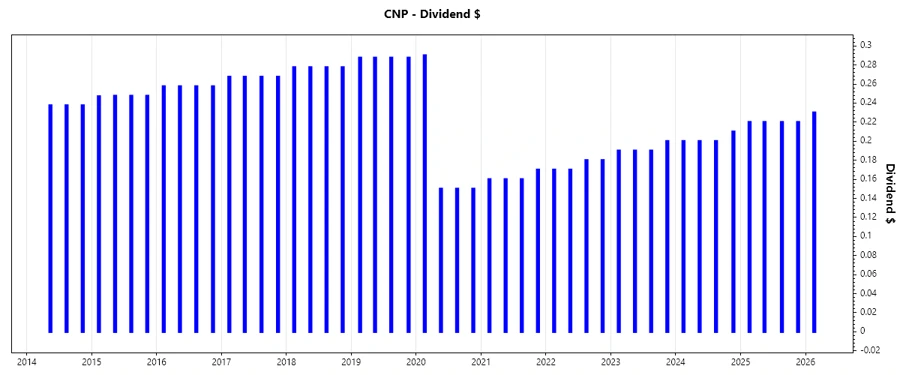
🗣️ Dividend History
The company's disciplined approach to dividend payments is evidenced by consistent delivery over several decades. This stability is fundamental for investors seeking reliable income amidst fluctuations in the broader market.
| Year | Dividend per Share (USD) |
|---|---|
| 2026 | 0.23 |
| 2025 | 0.88 |
| 2024 | 0.81 |
| 2023 | 0.77 |
| 2022 | 0.70 |
📈 Dividend Growth
Analyzing the growth trajectory of dividends is crucial to understanding long-term income potential. CenterPoint Energy has demonstrated a reliable upward trend in its dividend payouts, reflecting its focus on enhancing shareholder value.
| Time | Growth |
|---|---|
| 3 years | 7.93% |
| 5 years | 3.53% |
The average dividend growth is 3.53% over 5 years. This shows moderate but steady dividend growth.
📉 Payout Ratio
The payout ratio is a critical indicator of dividend sustainability. CenterPoint Energy maintains a balanced approach, ensuring sufficient earnings and cash flow to support future dividend disbursements.
| Key Figure | Ratio |
|---|---|
| EPS-based | 54.56% |
| Free Cash Flow-based | -24.07% |
While the EPS-based payout is at a sustainable level, the negative free cash flow ratio indicates potential pressure on cash reserves due to capital expenditures or similar factors, necessitating careful future financial planning.
✅ Cashflow & Capital Efficiency
The evaluation of cash flow stability and capital efficiency provides insight into operational effectiveness and financial health.
| Year | 2025 | 2024 | 2023 |
|---|---|---|---|
| Free Cash Flow Yield | -9.52% | -11.63% | -2.91% |
| Earnings Yield | 4.20% | 4.99% | 5.09% |
| CAPEX to Operating Cash Flow | 195.90% | 210.99% | 113.52% |
| Stock-based Compensation to Revenue | 0% | 0% | 0% |
| Free Cash Flow / Operating Cash Flow Ratio | -95.90% | -110.99% | -13.52% |
Despite the negative figures in free cash flow and high CAPEX, the company's earnings yield reflects the potential for earnings growth and long-term strategic investments to propel future returns.
⚠️ Balance Sheet & Leverage Analysis
A careful assessment of leverage and liquidity metrics provides a window into financial resilience and debt management strategy.
| Year | 2025 | 2024 | 2023 |
|---|---|---|---|
| Debt-to-Equity | 2.12 | 1.97 | 1.93 |
| Debt-to-Assets | 0.49 | 0.48 | 0.47 |
| Debt-to-Capital | 0.68 | 0.66 | 0.65 |
| Net Debt to EBITDA | 6.42 | 5.99 | 5.81 |
| Current Ratio | 0.91 | 0.91 | 0.78 |
| Quick Ratio | 0.91 | 0.91 | 0.58 |
| Financial Leverage | 4.33 | 4.10 | 4.11 |
The relatively high debt ratios suggest a leveraged position that could impact financial flexibility. Nonetheless, management's focus on operational efficiency continues to support debt obligations effectively.
📊 Fundamental Strength & Profitability
Understanding profitability measures offers insights into operational performance and strategic effectiveness.
| Year | 2025 | 2024 | 2023 |
|---|---|---|---|
| Return on Equity (ROE) | 9.43% | 9.55% | 9.49% |
| Return on Assets (ROA) | 2.18% | 2.33% | 2.31% |
| Net Margin | 11.24% | 11.79% | 10.55% |
| EBIT Margin | 22.98% | 23.74% | 20.56% |
| EBITDA Margin | 39.33% | 40.39% | 36.67% |
| Gross Margin | 28.71% | 46.00% | 42.39% |
| R&D to Revenue | 0% | 0% | 0% |
With consistent profitability margins across different metrics, CenterPoint Energy demonstrates robust fiscal health, making it a reliable performer in the utility sector.
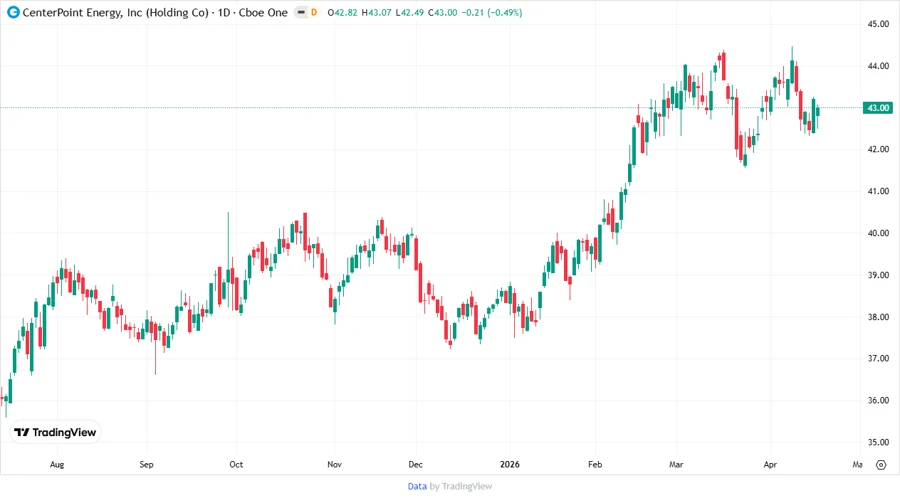
📈 Price Development
✅ Dividend Scoring System
| Category | Score | Visual |
|---|---|---|
| Dividend Yield | 3 | |
| Dividend Stability | 5 | |
| Dividend Growth | 4 | |
| Payout Ratio | 3 | |
| Financial Stability | 3 | |
| Dividend Continuity | 5 | |
| Cashflow Coverage | 2 | |
| Balance Sheet Quality | 3 |
Total Score: 28/40
🗣️ Rating
CenterPoint Energy, Inc. presents a compelling option for dividend investors due to its impressive stability and consistent performance in dividend payments. Despite some challenges in cash flow metrics, the company's long-standing commitment to shareholder returns makes it a sound investment. Consider for stable income in a diversified portfolio.