January 18, 2026 a 02:47 am


CNP: Dividend Analysis - CenterPoint Energy, Inc.
CenterPoint Energy, Inc. holds a strong position within the utilities sector, characterized by its impressive 57-year streak of consistent dividend payments. With a current dividend yield of 2.24% and a cautious yet steady increase over 3 and 5 years, the company offers stability in income generation. However, its payout ratios and cash flow metrics may require closer analysis to ensure sustainable dividend growth going forward.
Overview
CenterPoint Energy, Inc., a key figure in the utilities sector, has maintained a comforting track record in dividend payments, highlighting its commitment to returning value to shareholders. The following table lays out critical current metrics.
| Category | Detail |
|---|---|
| Sector | Utilities |
| Dividend yield | 2.24% |
| Current dividend per share | 0.81 USD |
| Dividend history | 57 years |
| Last cut or suspension | None |
Dividend History
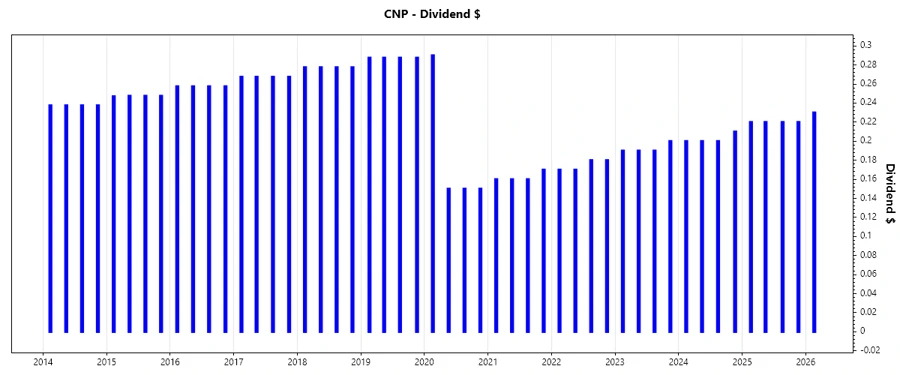
With an unbroken 57-year history of dividend payments, CenterPoint Energy exemplifies stability. Such historical reliability helps to assure investors of potential future income. Below, a visual representation accompanies recent data.
| Year | Dividend per Share (USD) |
|---|---|
| 2026 | 0.23 |
| 2025 | 0.88 |
| 2024 | 0.81 |
| 2023 | 0.77 |
| 2022 | 0.70 |
Dividend Growth
Understanding dividend growth is crucial for long-term income investors. A consistent growth rate signifies management’s confidence in future cash flows and earnings growth. Here’s the recent growth trajectory.
| Time | Growth |
|---|---|
| 3 years | 7.93% |
| 5 years | 3.53% |
The average dividend growth is 3.53% over 5 years. This shows moderate but steady dividend growth.
Payout Ratio
Monitoring payout ratios is essential, as they indicate the proportion of earnings paid out as dividends and the sustainability of current payouts. Let’s examine CenterPoint Energy’s ratios.
| Key Figure | Ratio |
|---|---|
| EPS-based | 53.26% |
| Free cash flow-based | -18.92% |
The EPS-based payout ratio of 53.26% suggests a responsible balance between reinvestment and returns to shareholders. However, the negative free cash flow payout ratio requires attention, indicating potential cash flow challenges.
Cashflow & Capital Efficiency
Cash flow metrics offer insights into a company’s financial health and efficiency in capital utilization. Below are key figures for recent years.
| Measure | 2024 | 2023 | 2022 |
|---|---|---|---|
| Free Cash Flow Yield | -11.63% | -2.91% | -13.82% |
| Earnings Yield | 4.99% | 5.09% | 5.60% |
| CAPEX to Operating Cash Flow | 2.11 | 1.14 | 2.44 |
| Stock-based Compensation to Revenue | 0% | 0% | 0% |
| Free Cash Flow / Operating Cash Flow Ratio | -1.11 | -0.14 | -1.44 |
The cash flow dynamics suggest challenges in maintaining a positive free cash flow, necessitating strategic capital management to boost operational efficiency.
Balance Sheet & Leverage Analysis
The balance sheet reveals financial stability and leverage, impacting a firm's capacity to weather financial challenges. Review the metrics below.
| Ratio | 2024 | 2023 | 2022 |
|---|---|---|---|
| Debt-to-Equity | 1.97 | 1.93 | 1.68 |
| Debt-to-Assets | 0.48 | 0.47 | 0.44 |
| Debt-to-Capital | 0.66 | 0.66 | 0.63 |
| Net Debt to EBITDA | 6.45 | 5.81 | 5.20 |
| Current Ratio | 1.08 | 0.78 | 0.92 |
| Quick Ratio | 0.91 | 0.58 | 0.75 |
| Financial Leverage | 4.10 | 4.11 | 3.84 |
With moderate to high leverage ratios, financial stability improvements are essential to mitigate risk and enhance liquidity.
Fundamental Strength & Profitability
Profitability metrics drive shareholder returns, illustrating operational efficiency and profitability. Below are the key performance indicators.
| Metric | 2024 | 2023 | 2022 |
|---|---|---|---|
| Return on Equity | 9.55% | 9.49% | 10.52% |
| Return on Assets | 2.33% | 2.31% | 2.74% |
| Net Margin | 11.79% | 10.55% | 11.34% |
| EBIT Margin | 23.74% | 20.56% | 20.82% |
| EBITDA Margin | 40.39% | 36.67% | 34.64% |
| Gross Margin | 46.00% | 42.39% | 36.44% |
| Research & Development to Revenue | 0% | 0% | 0% |
Return metrics reflect strong profitability levels, strengthening the basis for sustainable dividend distributions.
Dividend Scoring System
| Category | Score | Visualization |
|---|---|---|
| Dividend yield | 3 | |
| Dividend Stability | 5 | |
| Dividend growth | 3 | |
| Payout ratio | 2 | |
| Financial stability | 2 | |
| Dividend continuity | 4 | |
| Cashflow Coverage | 1 | |
| Balance Sheet Quality | 3 |
Total Score: 23/40
Rating
Considering its reliable dividend history and moderate growth, CenterPoint Energy, Inc. is a solid choice for income-oriented investors. However, the current free cash flow situation and leverage levels suggest a prudent approach. Continued monitoring of cash flow generation and debt reduction efforts will be critical to sustain its dividend profile.