August 21, 2025 a 02:47 am

CNP: Dividend Analysis - CenterPoint Energy, Inc.
CenterPoint Energy, Inc., a key player in the Utilities sector, showcases a respectable dividend yield of 2.26%, indicative of a stable yield for investors. However, its recent 5-year dividend growth has faced challenges, dropping slightly. Still, with 56 years of unbroken dividend history, CenterPoint demonstrates remarkable consistency. Its payout ratio relative to EPS is moderately conservative, providing room for future enhancements. Investors may find the overall dividend profile both intriguing and promising.
📊 Overview
The overview provides a snapshot of CenterPoint Energy's current dividend position along with sectoral insights.
| Metric | Details |
|---|---|
| Sector | Utilities |
| Dividend yield | 2.26% |
| Current dividend per share | $0.81 |
| Dividend history | 56 years |
| Last cut or suspension | None |
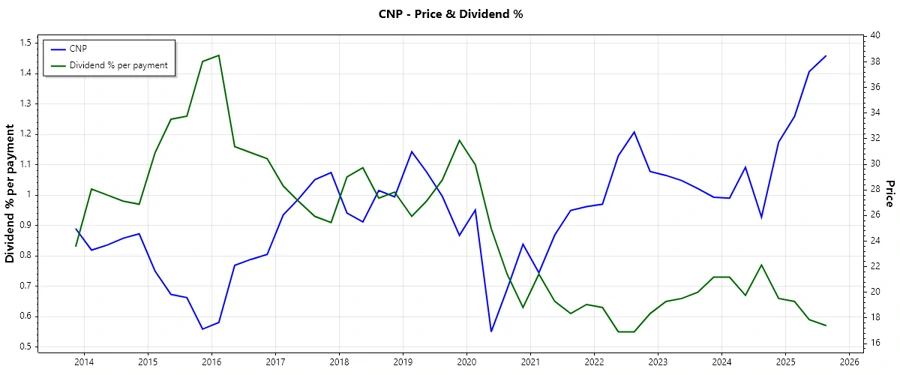
📈 Dividend History
Analyzing the dividend history helps gauge the company's performance consistency and its reliability in providing returns.
The following table outlines the last five dividend payments offered by CenterPoint Energy.
| Year | Dividend per Share (USD) |
|---|---|
| 2025 | 0.66 |
| 2024 | 0.81 |
| 2023 | 0.77 |
| 2022 | 0.70 |
| 2021 | 0.65 |
📉 Dividend Growth
Dividend growth is pivotal in understanding a company's long-term outlook and shareholder value appreciation.
| Time | Growth |
|---|---|
| 3 years | 7.61% |
| 5 years | -6.77% |
The average dividend growth is -6.77% over 5 years. This shows moderate but steady dividend growth amidst fluctuations.
Payout Ratio
Payout ratios evaluate how well a company's dividends are covered by its earnings.
| Key Figure | Ratio |
|---|---|
| EPS-based | 56.62% |
| Free cash flow-based | -17.00% |
The EPS-based payout ratio of 56.62% is reasonably balanced, suggesting efficient use of earnings to sustain dividends. However, the negative FCF coverage indicates potential cash flow challenges.
Cashflow & Capital Efficiency
Cash flow and capital efficiency metrics provide insights into the company’s operational monetization and capital allocation.
| Metric | 2022 | 2023 | 2024 |
|---|---|---|---|
| Free Cash Flow Yield | -13.82% | -2.91% | -11.63% |
| Earnings Yield | 5.60% | 5.09% | 4.99% |
| CAPEX to Operating Cash Flow | 2.44 | 1.14 | 2.11 |
| Stock-based Compensation to Revenue | 0.55% | 0% | 0% |
| Free Cash Flow / Operating Cash Flow Ratio | -1.44 | -0.14 | -1.11 |
Overall, the cashflow indicates operational challenges with negative free cash flow yields but potential earnings stability. Such discrepancies necessitate careful evaluation.
Balance Sheet & Leverage Analysis
Balance sheet analysis provides insights into financial stability and risk management through leverage ratios.
| Metric | 2022 | 2023 | 2024 |
|---|---|---|---|
| Debt-to-Equity | 1.68 | 1.93 | 1.97 |
| Debt-to-Assets | 0.44 | 0.47 | 0.48 |
| Debt-to-Capital | 0.63 | 0.66 | 0.66 |
| Net Debt to EBITDA | 5.20 | 5.81 | 6.00 |
| Current Ratio | 0.92 | 0.78 | 1.08 |
| Quick Ratio | 0.75 | 0.58 | 0.91 |
| Financial Leverage | 3.83 | 4.11 | 4.10 |
The incremental rise in leverage ratios suggests a growing reliance on debt for financing, meriting close monitoring of liquidity to ensure continued solvency.
Fundamental Strength & Profitability
Profitability metrics give a sense of efficiency in generating revenue and managing costs for competitive advantage.
| Metric | 2022 | 2023 | 2024 |
|---|---|---|---|
| Return on Equity | 10.52% | 9.49% | 9.55% |
| Return on Assets | 2.74% | 2.31% | 2.33% |
| Margins: Net | 11.34% | 10.54% | 11.79% |
| Margins: EBIT | 20.82% | 20.56% | 23.74% |
| Margins: EBITDA | 34.65% | 36.67% | 40.39% |
Maintaining robust equity returns and expanding margins reflects strategic prowess and operational efficacy, crucial for long-term growth sustainability.
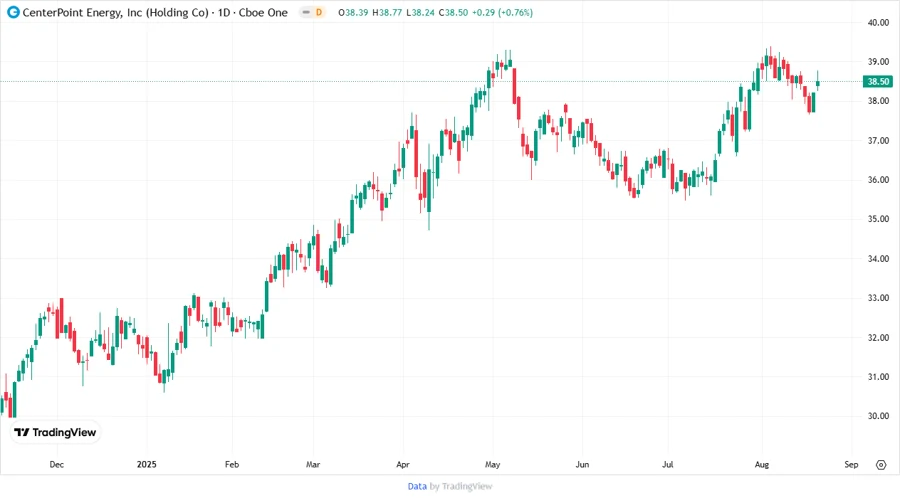
Price Development
Dividend Scoring System
| Criteria | Score | |
|---|---|---|
| Dividend yield | 4 | |
| Dividend Stability | 5 | |
| Dividend growth | 2 | |
| Payout ratio | 3 | |
| Financial stability | 3 | |
| Dividend continuity | 5 | |
| Cashflow Coverage | 2 | |
| Balance Sheet Quality | 3 |
Total Score: 27/40
Rating
In conclusion, CenterPoint Energy, Inc. holds a position of relative dividend stability and consistency, marked by impressive durability over decades. Despite facing hurdles in dividend growth and recent cashflow metrics, its solid track record promotes confidence in future performance. Informed investors may consider this investment opportunity as a potential component of a diversified dividend portfolio.
Smart Data Insight
Master the Perfect Entry & Exit for this Stock
Don't leave your profits to chance. Historically, this stock follows specific seasonal patterns that institutional traders use to maximize returns.
- ✅ Identify the "Golden Buying Window"
- ✅ Avoid high-risk correction cycles
- ✅ Backtested data from the last 20+ years