May 13, 2026 a 10:15 am
CNC: Fibonacci Analysis - Centene Corporation
The Centene Corporation (CNC) has shown a significant recovery after experiencing a steep decline in past months. This healthcare provider is known for catering to under-insured and uninsured populations in the U.S. The company's diverse range of services and programs through government-subsidized schemes continue to support its operational growth. Investors should closely monitor the technical levels as the current pricing approaches important Fibonacci retracement levels, which may determine future price direction.
Fibonacci Analysis
| Information | Details |
|---|---|
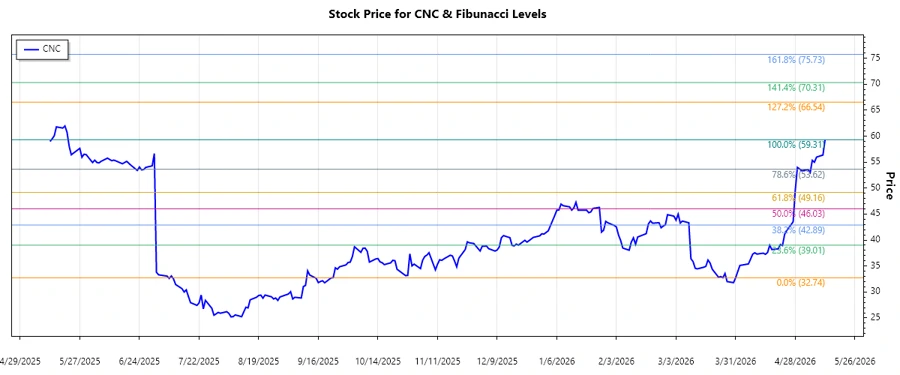
| Trend Start Date | 2026-03-31 |
| Trend End Date | 2026-05-12 |
| High Point (Price & Date) | $59.31 on 2026-05-12 |
| Low Point (Price & Date) | $32.74 on 2026-03-31 |
| Fibonacci Levels |
|
| Current Price Retracement Zone | None (Currently at $59.31) |
| Technical Interpretation | The current price is above all the retracement levels, indicating a strong bullish momentum. The levels may act as support in case of a pullback. |
Conclusion
The Centene Corporation's stock has experienced a robust upward trend, breaking through key Fibonacci retracement levels. Expectations for continued growth are bolstered by the company's strong operational foundation and strategic focus on healthcare services for under-insured and uninsured Americans. However, vigilance is required as the stock approaches overbought territories. Potential support levels around the Fibonacci marks might serve as strategic entry points for investors if pullbacks occur. Analysts should keenly observe market sentiment and external healthcare industry policies influencing the company's trajectory.
Smart Data Insight
Master the Perfect Entry & Exit for this Stock
Don't leave your profits to chance. Historically, this stock follows specific seasonal patterns that institutional traders use to maximize returns.
- ✅ Identify the "Golden Buying Window"
- ✅ Avoid high-risk correction cycles
- ✅ Backtested data from the last 20+ years