March 24, 2026 a 04:44 pm
CNC: Fibonacci Analysis - Centene Corporation
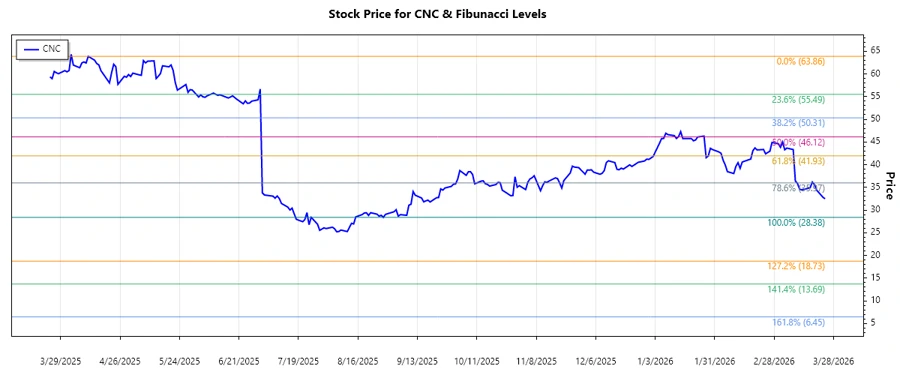
The Centene Corporation stock has been experiencing a highly volatile market over recent months. A significant downward trend was observed with fluctuating markets, reflecting broader economic uncertainties. Although showing some recovery signs, the stock remains susceptible to external pressures, making it an interesting case for close observation by investors.
Fibonacci Analysis
| Detail | Information |
|---|---|
| Trend Start Date | 2025-05-01 |
| Trend End Date | 2026-03-24 |
| High Price (Date) | $63.86 (2025-04-11) |
| Low Price (Date) | $28.38 (2025-08-28) |
| Fibonacci Level 0.236 | $38.61 |
| Fibonacci Level 0.382 | $41.67 |
| Fibonacci Level 0.5 | $46.12 |
| Fibonacci Level 0.618 | $50.57 |
| Fibonacci Level 0.786 | $56.20 |
The current stock price is within the 0.236 retracement zone, indicating a potential support level. Traders often look for upward reversals at this point, but caution is advised due to potential further downward pressure.
Conclusion
The Centene Corporation's stock has navigated a challenging downward trajectory with marked price declines. The significant drop could pose risks, yet also present opportunities for long-term investors considering potential recovery. The identified Fibonacci levels offer critical insights into possible support and resistance points, useful for strategizing entry and exit positions. Analysts remain watchful of both macroeconomic influences and internal company developments that might affect stock performance.