March 02, 2026 a 11:44 am
CNC: Fibonacci Analysis - Centene Corporation
Centene Corporation's stock has shown substantial movement, with significant fluctuations in the short term. Notable changes in the stock price reflect the dynamic nature of the healthcare sector. Understanding the technical outlook for Centene's stock is crucial for investors positioning themselves in the managed healthcare industry.
Fibonacci Analysis
| Attribute | Details |
|---|---|
| Start of Trend | 2025-11-20 |
| End of Trend | 2026-02-27 |
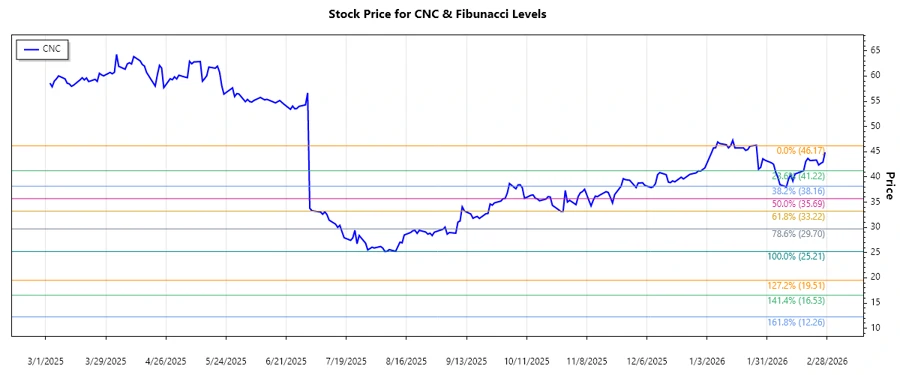
| Highest Price | $46.17 on 2025-11-20 |
| Lowest Price | $25.21 on 2025-08-06 |
Fibonacci Retracement Levels
| Level | Price |
|---|---|
| 0.236 | $32.15 |
| 0.382 | $36.26 |
| 0.5 | $39.50 |
| 0.618 | $42.74 |
| 0.786 | $45.37 |
As of now, the current price is $44.88, placing it above the 0.618 Fibonacci level, suggesting a retracement in motion. Technical interpretation indicates potential resistance around these levels, which could impact future price action.
Conclusion
Centene Corporation's recent stock performance shows a retracement from a prominent downtrend. With its price currently sitting above the 0.618 Fibonacci level, investors may observe potential resistance. This technical behavior may indicate consolidation or minor pullbacks before any sustained upward movement. Caution is advised, as the healthcare sector remains susceptible to policy changes. Opportunities might exist for long-term investors seeking positions in growth-driven health services. Monitoring market sentiment and industry developments remains essential for making informed investment decisions.