March 21, 2026 a 04:03 am
CMI: Trend and Support & Resistance Analysis - Cummins Inc.
Cummins Inc. has shown a dynamic trend in its stock prices influenced by its operations in diverse sectors. The company has recently experienced fluctuations in its stock values, presenting potential opportunities for investors. An analysis of the current technical indicators reveals important insights into the future trajectory of Cummins' stock price.
Trend Analysis
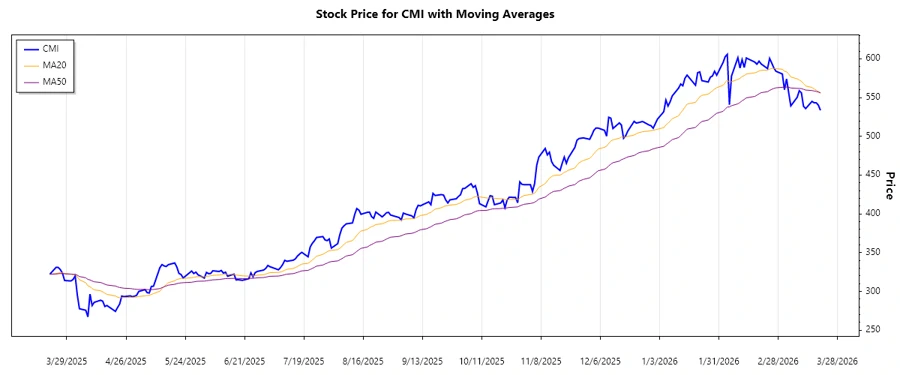
The Cummins Inc. stock has shown variability in recent months with notable trends. Using the closing prices provided, we calculated the Exponential Moving Averages (EMA) for the 20-day and 50-day periods to analyze the trend.
| Date | Closing Price | Trend |
|---|---|---|
| 2026-03-20 | 533.54 | ▼ Abwärtstrend |
| 2026-03-19 | 540.24 | ▼ Abwärtstrend |
| 2026-03-18 | 543.29 | ▼ Abwärtstrend |
| 2026-03-17 | 543.27 | ▼ Abwärtstrend |
| 2026-03-16 | 545.03 | ▼ Abwärtstrend |
| 2026-03-13 | 535.71 | ▼ Abwärtstrend |
| 2026-03-12 | 538.75 | ▼ Abwärtstrend |
The EMA20 calculated is lower than the EMA50, indicating a persistent downward trend (▼) in the last observed week, suggesting potential caution for short-term investors.
Support- and Resistance
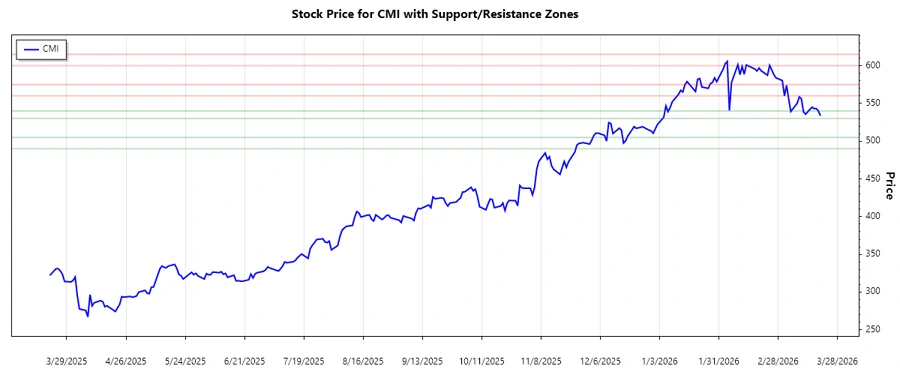
Analyzing the historical price data, we identified key support and resistance zones critical for understanding potential turnaround points in the stock's trajectory.
| Zone Type | From | To |
|---|---|---|
| Support Zone 1 | 490.00 | 505.00 |
| Support Zone 2 | 530.00 | 540.00 |
| Resistance Zone 1 | 560.00 | 575.00 |
| Resistance Zone 2 | 600.00 | 615.00 |
Current prices are nearing the lower support levels, indicating a potential for a bounce back if buying interest sustains, or a breakthrough if bearish momentum continues.
Conclusion
Cummins Inc. currently faces a bearish trend which presents caution for immediate investments. However, as the price approaches critical support zones, it presents a potential opportunity for long-term entry should the price stabilize or reverse. Analysts are advised to watch for breaks in the support zones or a consolidation within them for a clearer understanding of future price action.