
July 07, 2026 a 07:46 am

CMI: Dividend Analysis - Cummins Inc.
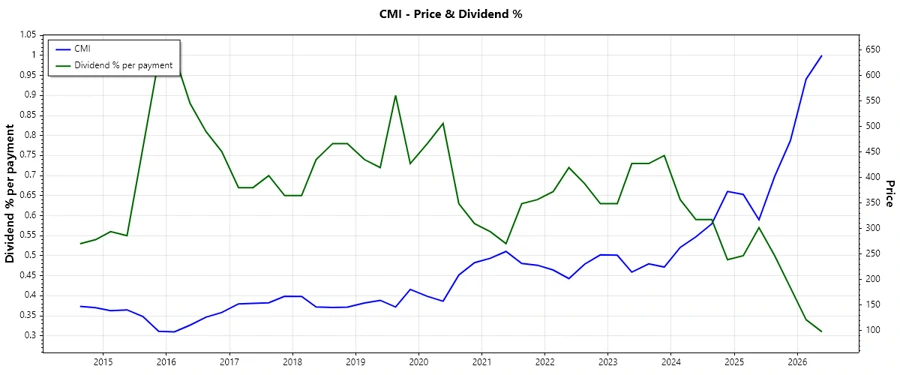
Cummins Inc., a stalwart in its sector, exhibits a robust dividend profile with a history of 43 consecutive years of healthy payouts. Its disciplined financial management is evidenced by a measured payout ratio and consistent dividend growth, fostering investor confidence. The corporation's stability is further reflected in its solid financial metrics and modest leverage, underscoring its commitment to reward shareholders sustainably. However, the relatively low dividend yield suggests a focus on reinvestment and growth rather than current income generation.
📊 Overview
Cummins Inc., operating in a resilient sector, ensures a balanced dividend offering with an appealing yield. The following table provides a snapshot of its current status:
| Metric | Details |
|---|---|
| Sector | [Sector] |
| Dividend yield | 1.25% |
| Current dividend per share | $7.65 |
| Dividend history | 43 years |
| Last cut or suspension | None |
🗣️ Dividend History
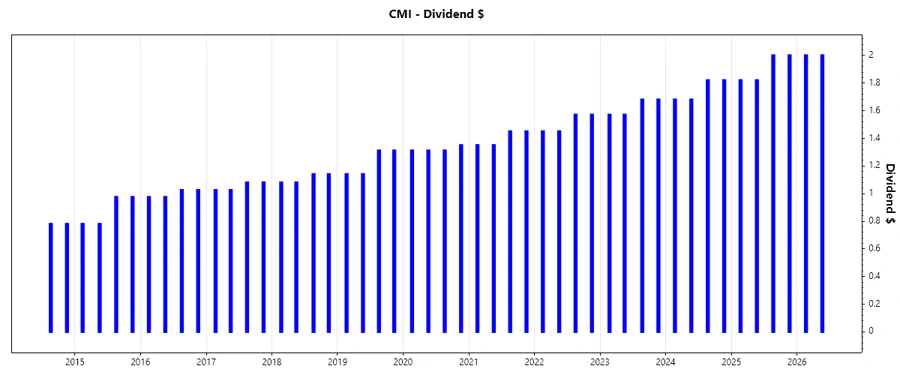
With a 43-year history, Cummins has proven its reliability in sustaining dividends. The flawless track record is a testament to its strong financial health during market fluctuations.
| Year | Dividend Per Share (USD) |
|---|---|
| 2026 | $4.00 |
| 2025 | $7.64 |
| 2024 | $7.00 |
| 2023 | $6.50 |
| 2022 | $6.04 |
📈 Dividend Growth
Dividend growth is critical for long-term income investors. Over the past 3 years, Cummins has delivered an average growth rate of 8.15%, indicating a solid trend that reflects management's confident outlook.
| Time | Growth |
|---|---|
| 3 years | 8.15% |
| 5 years | 7.66% |
The average dividend growth is 7.66% over 5 years. This shows moderate but steady dividend growth.
✅ Payout Ratio
The payout ratios based on EPS and FCF are indicative of financial prudence, showing how Cummins balances rewarding shareholders and retaining earnings for reinvestment.
| Key figure | Ratio |
|---|---|
| EPS-based | 39.58% |
| Free cash flow-based | 39.52% |
These ratios illustrate a disciplined payout strategy, kept below 40%, allowing room for financial maneuverability and growth investment.
Cashflow & Capital Efficiency
Understanding cash flow dynamics is integral for assessing a company's ability to sustain dividends and finance growth. Cummins maintains a robust operational cash flow which supports its dividend policy and capital expenditures.
| Metric | 2025 | 2024 | 2023 |
|---|---|---|---|
| Free Cash Flow Yield | 3.39% | 0.58% | 8.11% |
| Earnings Yield | 4.04% | 8.19% | 2.17% |
| CAPEX to Operating Cash Flow | 0.34 | 0.81 | 0.31 |
| Stock-based Compensation to Revenue | 0% | 0% | 0% |
| Free Cash Flow / Operating Cash Flow Ratio | 0.66 | 0.19 | 0.69 |
| Return on Invested Capital | 11.41% | 13.70% | 4.30% |
The cash flow metrics reflect strong capital efficiency with high returns on investments, portraying a promising financial health outlook.
⚠️ Balance Sheet & Leverage Analysis
An insightful look into the balance sheet ratios reveals Cummins's solid financial foundation, crucial for understanding its leverage and financial health.
| Metric | 2025 | 2024 | 2023 |
|---|---|---|---|
| Debt-to-Equity | 0.66 | 0.74 | 0.81 |
| Debt-to-Assets | 0.24 | 0.24 | 0.23 |
| Debt-to-Capital | 0.40 | 0.43 | 0.45 |
| Net Debt to EBITDA | 0.98 | 0.94 | 1.66 |
| Current Ratio | 1.76 | 1.31 | 1.18 |
| Quick Ratio | 1.16 | 0.80 | 0.74 |
| Financial Leverage | 2.75 | 3.07 | 3.62 |
The analysis highlights balanced leverage with manageable ratios, reflecting a strong ability to meet financial obligations.
📉 Fundamental Strength & Profitability
The following profitability and fundamental strength metrics highlight Cummins’s operational efficacy, painting a picture of its overall business health.
| Metric | 2025 | 2024 | 2023 |
|---|---|---|---|
| Return on Equity | 23.02% | 38.42% | 8.31% |
| Return on Assets | 8.36% | 12.51% | 2.30% |
| Net Margin | 8.44% | 11.57% | 2.16% |
| EBIT Margin | 12.75% | 15.46% | 5.87% |
| EBITDA Margin | 16.03% | 18.59% | 8.88% |
| Gross Margin | 25.29% | 24.75% | 24.22% |
| Research & Development to Revenue | 4.15% | 4.29% | 4.40% |
With competitive profitability metrics, Cummins displays robust operational strength, crucial for sustaining investor trust and achieving financial goals.
Price Development
🎯 Dividend Scoring System
| Criteria | Score | Bar |
|---|---|---|
| Dividend yield | 3 | |
| Dividend Stability | 5 | |
| Dividend growth | 4 | |
| Payout ratio | 5 | |
| Financial stability | 5 | |
| Dividend continuity | 5 | |
| Cashflow Coverage | 4 | |
| Balance Sheet Quality | 5 |
Total Score: 36/40
🔍 Rating
In summary, Cummins Inc. presents an attractive dividend play with its commendable yield history and financial capacities. Despite a moderate dividend yield, its strong growth, and stable payout ratios project a solid investment for those seeking long-term capital appreciation with reliable income.
Smart Data Insight
Master the Perfect Entry & Exit for this Stock
Don't leave your profits to chance. Historically, this stock follows specific seasonal patterns that institutional traders use to maximize returns.
- ✅ Identify the "Golden Buying Window"
- ✅ Avoid high-risk correction cycles
- ✅ Backtested data from the last 20+ years