October 04, 2025 a 07:47 am
CMI: Dividend Analysis - Cummins Inc.
Cummins Inc. demonstrates a robust and stable dividend profile with a consistent history of payments and growth, coupled with sound financial fundamentals. Despite market volatility, CMI's commitment to rewarding shareholders through dividends remains a cornerstone of its financial strategy. Investors can find confidence in the company's resilience and predictable dividend yields.
📊 Overview
Cummins Inc. operates in the Industrials sector, a field known for its capital-intensive nature and cyclical trends. The company currently offers a dividend yield of 1.85%, with the present dividend per share standing at $7.01. Notably, CMI boasts an impressive dividend history of 42 consecutive years, without any recent cuts or suspensions in its payout schedule.
| Detail | Value |
|---|---|
| Sector | Industrials |
| Dividend Yield | 1.85% |
| Current Dividend per Share | $7.01 USD |
| Dividend History | 42 years |
| Last Cut or Suspension | None |
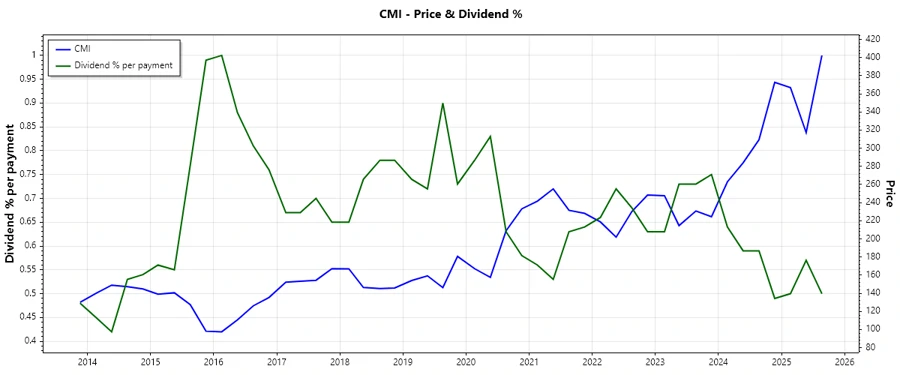
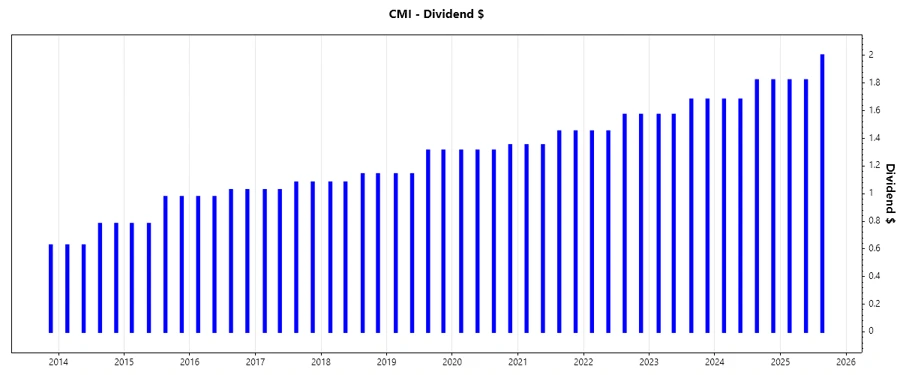
🗣️ Dividend History
The importance of historical dividend data cannot be overstated as it reflects the company's commitment to returning capital to shareholders. CMI's long and steady history of dividends showcases its financial health and prioritization of shareholder rewards.
| Year | Dividend Per Share (USD) |
|---|---|
| 2025 | 5.64 |
| 2024 | 7.00 |
| 2023 | 6.50 |
| 2022 | 6.04 |
| 2021 | 5.60 |
📈 Dividend Growth
Dividend growth is a crucial indicator of a company's future financial prospects and commitment to increasing shareholder returns. CMI has demonstrated a modest steady growth in dividends, which is indicative of its enduring profitability and fiscal prudence.
| Time | Growth |
|---|---|
| 3 years | 7.72% |
| 5 years | 7.39% |
The average dividend growth is 7.39% over 5 years. This shows moderate but steady dividend growth, reassuring for long-term investors.
✅ Payout Ratio
Payout ratios offer insight into how sustainable a dividend payout is concerning a company's earnings and cash flow. CMI maintains a conservative EPS-based payout ratio of 32.83%, indicating robust dividend coverage. The FCF-based payout ratio of 58.48% further highlights effective financial management and a balance between dividends and reinvestment in the business.
| Key Figure | Ratio |
|---|---|
| EPS-based | 32.83% |
| Free Cash Flow-based | 58.48% |
With an EPS payout ratio of 32.83% and FCF payout ratio at 58.48%, Cummins exhibits strong dividend sustainability and allocates capital judiciously.
📈 Cashflow & Capital Efficiency
Cashflow metrics are vital for evaluating the sustainability of dividends under diverse market conditions. The capital efficiency ratios further underscore how effectively the company employs its capital assets to generate returns.
| Metric | 2024 | 2023 | 2022 |
|---|---|---|---|
| Free Cash Flow Yield | 0.58% | 8.11% | 3.05% |
| Earnings Yield | 8.19% | 2.17% | 6.27% |
| CAPEX to Operating Cash Flow | 81.24% | 30.58% | 46.69% |
| Stock-based Compensation to Revenue | 0% | 0% | 0.12% |
| Free Cash Flow / Operating Cash Flow Ratio | 18.76% | 69.42% | 53.31% |
Analysis of the cash flow stability points to CMI's strong handling of operational cash flows, which supports a comfortable dividend coverage, reflecting prudent financial administration.
⚠️ Balance Sheet & Leverage Analysis
A detailed balance sheet analysis provides insight into Cummins' leverage and liquidity levels, which are crucial for understanding potential financial stress under adverse conditions.
| Metric | 2024 | 2023 | 2022 |
|---|---|---|---|
| Debt-to-Equity | 0.74 | 0.81 | 0.93 |
| Debt-to-Assets | 0.24 | 0.23 | 0.28 |
| Debt-to-Capital | 0.43 | 0.45 | 0.48 |
| Net Debt to EBITDA | 0.94 | 1.66 | 1.64 |
| Current Ratio | 1.31 | 1.18 | 1.27 |
| Quick Ratio | 0.80 | 0.74 | 0.77 |
| Financial Leverage | 3.07 | 3.62 | 3.38 |
Through tight management of capital, CMI maintains a relatively low debt profile, ensuring long-term financial stability and reducing investor risk.
💹 Fundamental Strength & Profitability
Profitability indicators are fundamental to evaluating the company's efficiency in generating profits from its operations, a crucial aspect of its capability to sustain shareholder returns.
| Metric | 2024 | 2023 | 2022 |
|---|---|---|---|
| Return on Equity | 38.42% | 8.31% | 23.97% |
| Return on Assets | 12.51% | 2.30% | 7.10% |
| Margins: Net | 15.46% | 5.87% | 13.54% |
| EBIT Margin | 15.46% | 5.87% | 13.54% |
| EBITDA Margin | 18.59% | 8.88% | 11.08% |
| Gross Margin | 24.75% | 24.22% | 23.93% |
| Research & Development to Revenue | 4.29% | 4.40% | 4.55% |
With strong ROE and sustained gross margins, Cummins continues to showcase its operational efficiency and strategic focus on profitability, reinforcing the confidence of potential long-term investors.
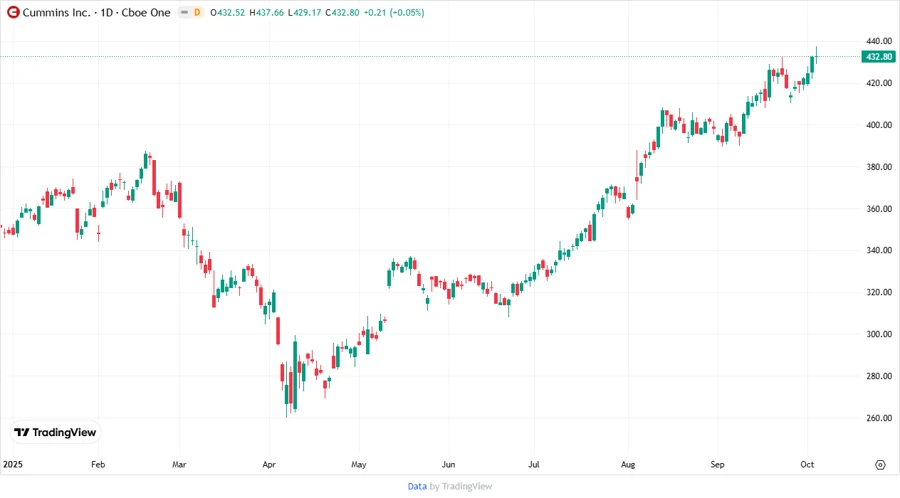
📉 Price Development
🗳️ Dividend Scoring System
| Criteria | Score | Score Bar |
|---|---|---|
| Dividend Yield | 4 | |
| Dividend Stability | 5 | |
| Dividend Growth | 4 | |
| Payout Ratio | 5 | |
| Financial Stability | 5 | |
| Dividend Continuity | 5 | |
| Cashflow Coverage | 4 | |
| Balance Sheet Quality | 4 |
Total Score: 36/40
🔍 Rating
Cummins Inc. is rated as a strong dividend stock with commendable payout ratios, sustainable growth, and excellent financial health. The robust scoring reflects confidence in its ability to continue rewarding shareholders effectively. Given its well-balanced financial metrics and strategic prowess, CMI remains a recommended pick for income-focused investors.
Smart Data Insight
Master the Perfect Entry & Exit for this Stock
Don't leave your profits to chance. Historically, this stock follows specific seasonal patterns that institutional traders use to maximize returns.
- ✅ Identify the "Golden Buying Window"
- ✅ Avoid high-risk correction cycles
- ✅ Backtested data from the last 20+ years