November 16, 2025 a 02:03 pm

CME: Trend and Support & Resistance Analysis - CME Group Inc.
CME Group Inc., a powerhouse in global derivatives markets, has experienced fluctuations over recent months. With a varied product range, it remains susceptible to market dynamics, particularly in commodities and interest rates. Investors are eyeing its strategic adaptations in response to market volatility.
Trend Analysis
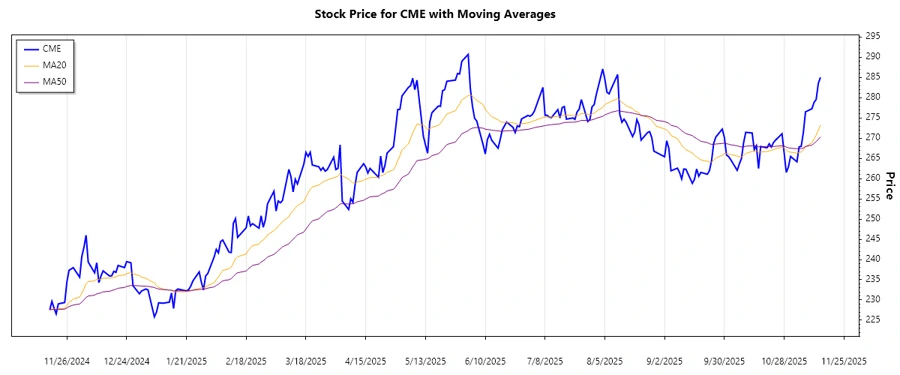
Analyzing the recent trend patterns of CME Group Inc., we observe that the stock has shown a notable upward trajectory. The calculated exponential moving averages (EMA) reveal EMA20 at 274.51 and EMA50 at 270.13, clearly indicating a ▲ Uptrend as EMA20 > EMA50. Here’s a snapshot of the past seven days:
| Date | Close Price | Trend |
|---|---|---|
| 2025-11-14 | 285.04 | ▲ Upwards |
| 2025-11-13 | 283.54 | ▲ Upwards |
| 2025-11-12 | 279.58 | ▲ Upwards |
| 2025-11-11 | 278.84 | ▲ Upwards |
| 2025-11-10 | 277.28 | ▲ Upwards |
| 2025-11-07 | 276.50 | ▲ Upwards |
| 2025-11-06 | 271.42 | ▲ Upwards |
The continuation of this upward trend may attract bullish investors, potentially leading to increased buying pressure. Yet, market participants should remain cautious of potential corrections.
Support and Resistance
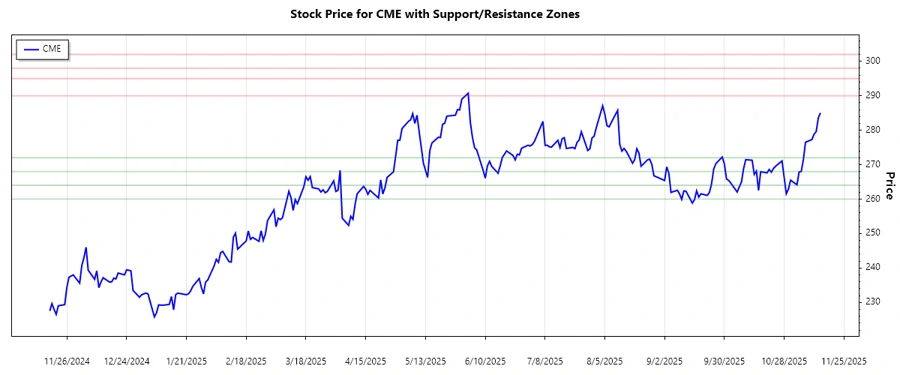
Based on a comprehensive assessment of the current price levels, critical support and resistance zones have been identified. These zones could act as pivotal points where price corrections or rallies may occur. The zones are calculated as follows:
| Zone Type | From | To |
|---|---|---|
| Support 1 | 268.00 | 272.00 |
| Support 2 | 260.00 | 264.00 |
| Resistance 1 | 290.00 | 295.00 |
| Resistance 2 | 298.00 | 302.00 |
The current stock price of $285.04 is nearing the lower boundary of the first resistance zone. Investors may anticipate potential breakout or reversal signals. Continuous monitoring is advised to navigate through these pivotal ranges.
Conclusion
CME Group Inc. is positioned within a definite upward trend, spotlighting optimistic sentiment among traders and investors. The identified support and resistance zones cement the foundation for strategic decision-making, where breakouts or consolidations can define future price movements. In this environment, investors need to weigh opportunities against inherent market risks, especially considering CME's exposure to volatile financial derivatives. For analysts, keeping abreast with market indicators will prove essential to capture profitable ventures.