April 28, 2026 a 03:43 pm
CME: Fundamental Ratio Analysis - CME Group Inc.
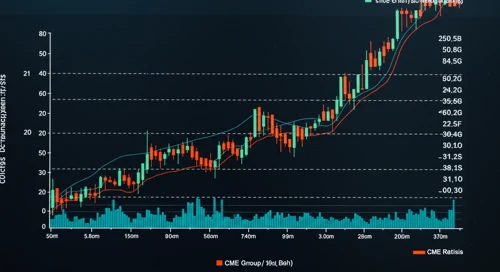
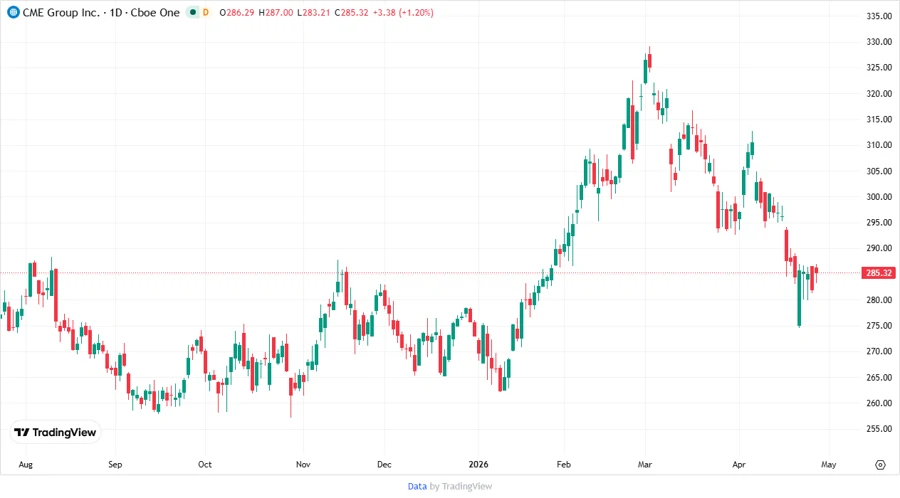
CME Group Inc. is a leading player in the financial services sector, specifically within financial data and stock exchanges. It operates a diverse range of contract markets and provides extensive services that cater to professional traders and various financial institutions. As a well-established entity, CME Group's stock is pivotal for understanding financial market trends.
Fundamental Rating
CME Group Inc. has shown a strong fundamental base with specific strengths in return on equity and assets.
| Category | Score | Visual |
|---|---|---|
| Discounted Cash Flow | 4 | |
| Return on Equity | 5 | |
| Return on Assets | 5 | |
| Debt to Equity | 3 | |
| Price to Earnings | 1 | |
| Price to Book | 1 |
Historical Rating
The historical data provides insight into the consistency and changes in fundamental scores over time.
| Date | Overall Score | DCF | ROE | ROA | Debt/Equity | P/E | P/B |
|---|---|---|---|---|---|---|---|
| 2026-04-28 | 3 | 4 | 5 | 5 | 3 | 1 | 1 |
| 2026-04-27 | 3 | 4 | 5 | 5 | 3 | 1 | 1 |
Analyst Price Targets
The price targets reflect current market sentiment and expectations from analysts.
| High | Low | Median | Consensus |
|---|---|---|---|
| $353 | $302 | $313 | $320.25 |
Analyst Sentiment
The sentiment among analysts gives an indication of potential market movements and investor confidence.
| Recommendation | Count | Visual Representation |
|---|---|---|
| Strong Buy | 0 | |
| Buy | 13 | |
| Hold | 17 | |
| Sell | 5 | |
| Strong Sell | 0 |
Conclusion
CME Group Inc. reflects a strong financial foundation with particular strengths in return on equity and assets; however, the price-to-earnings and price-to-book ratios indicate potential valuation concerns. Analysts give a consensus of holding the stock, with no recommendations for a strong buy or strong sell. Investors should weigh these factors against economic and industry dynamics before making investment decisions.
Smart Data Insight
Master the Perfect Entry & Exit for this Stock
Don't leave your profits to chance. Historically, this stock follows specific seasonal patterns that institutional traders use to maximize returns.
- ✅ Identify the "Golden Buying Window"
- ✅ Avoid high-risk correction cycles
- ✅ Backtested data from the last 20+ years