
September 29, 2025 a 08:00 am
CME: Fundamental Ratio Analysis - CME Group Inc.
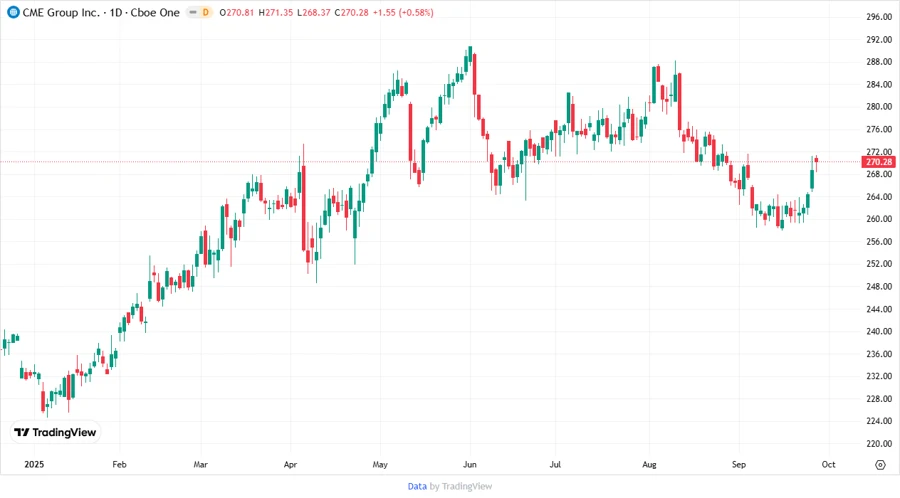
CME Group Inc. operates global markets for trading futures and options, catering to various industries. With its comprehensive offerings, CME ensures market stability and efficiency, making it a pivotal player in financial services. However, like any financial entity, market volatility can influence its performance.
Fundamental Rating
CME Group Inc. has a stable overall performance. Below are the ratings in various financial metrics:
| Category | Score | Visualization |
|---|---|---|
| Discounted Cash Flow (DCF) | 4 | |
| Return on Equity (ROE) | 4 | |
| Return on Assets (ROA) | 4 | |
| Debt to Equity | 3 | |
| Price to Earnings | 1 | |
| Price to Book | 1 |
Historical Rating
Comparing the current and past fundamental scores to assess company performance trends:
| Date | Overall | DCF | ROE | ROA | Debt/Equity | P/E | P/B |
|---|---|---|---|---|---|---|---|
| 2025-09-26 | 3 | 4 | 4 | 4 | 3 | 1 | 1 |
| Previous | 0 | 4 | 4 | 4 | 3 | 1 | 1 |
Analysts' Price Targets
The anticipated price targets by analysts depict a balanced outlook:
| High | Low | Median | Consensus |
|---|---|---|---|
| $298 | $285 | $291.5 | $291.5 |
Analysts' Sentiment
CME Group Inc. is generally viewed as a stable hold by analysts:
| Recommendation | Count | Representation |
|---|---|---|
| Strong Buy | 0 | |
| Buy | 12 | |
| Hold | 17 | |
| Sell | 5 | |
| Strong Sell | 0 |
Conclusion
CME Group Inc. showcases robust futures and options trading markets, providing stability in financial services. Its fundamental scores illustrate strength, though there is room for improvement in valuation metrics like P/E and P/B. The overall analyst sentiment remains neutral, indicating limited immediate growth potential. While the current market climate favors holding the stock, emerging market trends and innovations could trigger future revaluation.
Smart Data Insight
Master the Perfect Entry & Exit for this Stock
Don't leave your profits to chance. Historically, this stock follows specific seasonal patterns that institutional traders use to maximize returns.
- ✅ Identify the "Golden Buying Window"
- ✅ Avoid high-risk correction cycles
- ✅ Backtested data from the last 20+ years