October 31, 2025 a 10:15 am
CME: Fibonacci Analysis - CME Group Inc.
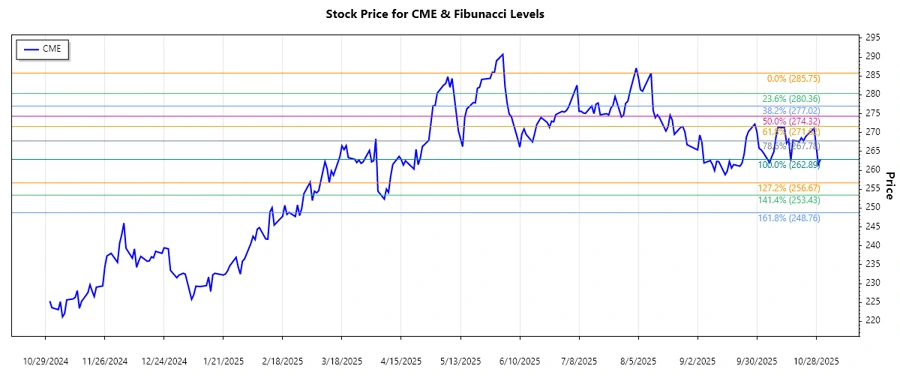
The current trend analysis of CME Group Inc. stock suggests a dominant downtrend from August to October 2025. This period reflects a significant decline in stock price, likely influenced by market volatility and macroeconomic factors impacting the financial sector. As CME Group continues to navigate this challenging environment, the retracement levels will be crucial in identifying potential support and resistance zones.
Fibonacci Analysis
| Parameter | Value |
|---|---|
| Analyzed Trend Start Date | 2025-08-11 |
| Analyzed Trend End Date | 2025-10-30 |
| High Price Date | 2025-08-11 |
| High Price | 285.75 |
| Low Price Date | 2025-10-30 |
| Low Price | 262.89 |
| Fibonacci Level | Price |
|---|---|
| 0.236 | 280.63 |
| 0.382 | 277.09 |
| 0.5 | 274.32 |
| 0.618 | 271.55 |
| 0.786 | 267.66 |
The current price of $262.89 is below the 0.786 retracement level, suggesting that the price is in a strong downtrend phase. This indicates potential for further downward movement unless a reversal or consolidation pattern emerges. Technically, these levels can act as potential support points; however, the continuation of the downtrend may override these considerations.
Conclusion
The current downward trend in CME Group Inc. stock reflects heightened caution in the market and potential pressures from broader economic challenges. Short-term investors may find retracement levels to provide temporary support, yet risks of further downturns remain prevalent. Analyst attention is drawn towards monitoring macroeconomic indicators and market data that might offer insights into potential trend reversals. The strategic focus will likely encompass risk mitigation and timing for entry or exit points in alignment with these technical indicators.
Smart Data Insight
Master the Perfect Entry & Exit for this Stock
Don't leave your profits to chance. Historically, this stock follows specific seasonal patterns that institutional traders use to maximize returns.
- ✅ Identify the "Golden Buying Window"
- ✅ Avoid high-risk correction cycles
- ✅ Backtested data from the last 20+ years