February 20, 2026 a 02:46 am

CME: Dividend Analysis - CME Group Inc.
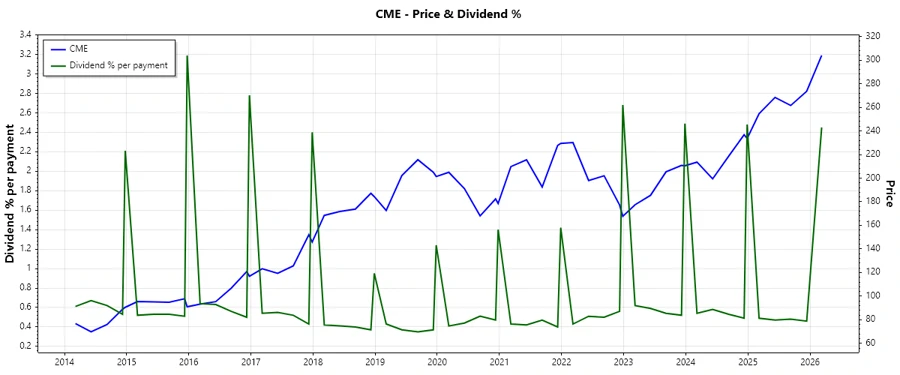
CME Group Inc., a major player in the financial services sector, presents a robust dividend profile with a current yield of 3.69%. The company's strong historical dividend payout, combined with its strategic approach in managing payouts and market positioning, makes it an attractive option for income-focused investors. However, potential investors ought to be cautious about the recent dividend cuts, as indicated by the history.
📊 Overview
| Metric | Details |
|---|---|
| Sector | Financial Services |
| Dividend yield | 3.69 % |
| Current dividend per share | 5 USD |
| Dividend history | 24 years |
| Last cut or suspension | 2025 |
🗣️ Dividend History
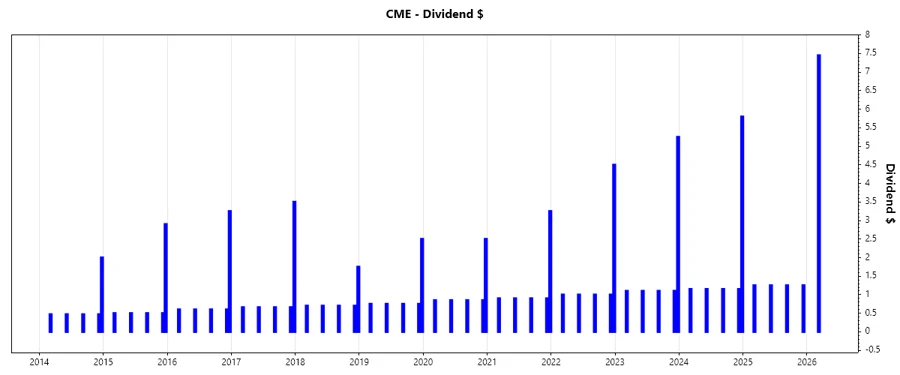
The dividend history of a company offers insights into its reliability and commitment to returning capital to shareholders. A 24-year track record underscores CME Group Inc.'s consistency in paying dividends. Recent reductions should be analyzed in the context of broader strategic adjustments.
| Year | Dividend per Share (USD) |
|---|---|
| 2026 | 7.45 |
| 2025 | 5.00 |
| 2024 | 10.40 |
| 2023 | 9.65 |
| 2022 | 8.5 |
📈 Dividend Growth
Assessment of dividend growth over years is critical for understanding a company's potential for generating shareholder value. Negative growth in the last three and five years necessitates careful consideration of future prospects.
| Time | Growth |
|---|---|
| 3 years | -0.16 % |
| 5 years | -0.03 % |
The average dividend growth is -0.03 % over 5 years. This shows moderate but steady dividend growth.
✅ Payout Ratio
Understanding the payout ratio of a company helps gauge its sustainability in paying dividends. A payout that covers both EPS and FCF presents a balanced view of profit allocation.
| Key figure | Ratio |
|---|---|
| EPS-based | 44.46 % |
| Free cash flow-based | 44.02 % |
A payout ratio of 44.46 % (EPS) and 44.02 % (FCF) indicates a well-managed approach to maintaining dividend payments without over-leveraging the company’s financials.
Cashflow & Capital Efficiency
Efficient cash flow management is integral to sustaining dividends and overall financial health. Metrics such as FCF Yield, CAPEX to Operating Cash Flow, and Stock Compensation to Revenue, among others, reveal the firm's operational efficiency and capital allocation priorities.
| 2025 | 2024 | 2023 |
|---|---|---|
| 0 % | 4.31 % | 4.47 % |
| 0 % | 2.55 % | 2.21 % |
| 0 % | 1.46 % | 1.49 % |
| 0 % | 97.45 % | 97.79 % |
The company's robust Free Cash Flow relative to Operating Cash Flow underpins its ability to sustain dividends while ensuring disciplined capital spending.
Balance Sheet & Leverage Analysis
A firm’s leverage and liquidity ratios provide insights into its financial stability and risk exposure. The analysis covers Debt-to-Equity, Current Ratio, Financial Leverage, etc.
| 2025 | 2024 | 2023 |
|---|---|---|
| 11.91 % | 12.94 % | 12.81 % |
| 1.72 % | 2.49 % | 2.64 % |
| 10.64 % | 11.46 % | 11.36 % |
The ratios indicate strong financial health, with modest leverage and excellent interest coverage, suggesting capacity for additional debt if needed.
Fundamental Strength & Profitability
Profitability metrics demonstrate a company's efficiency in converting revenue into profit and its potential for future earnings growth. Examination of ROE, Margins, and R&D allocation validates earnings quality.
| 2025 | 2024 | 2023 |
|---|---|---|
| 14.08 % | 13.31 % | 12.07 % |
| 2.04 % | 2.56 % | 2.49 % |
Consistent returns and margin management indicate strategic focus on sustaining profitability and competitive advantage.
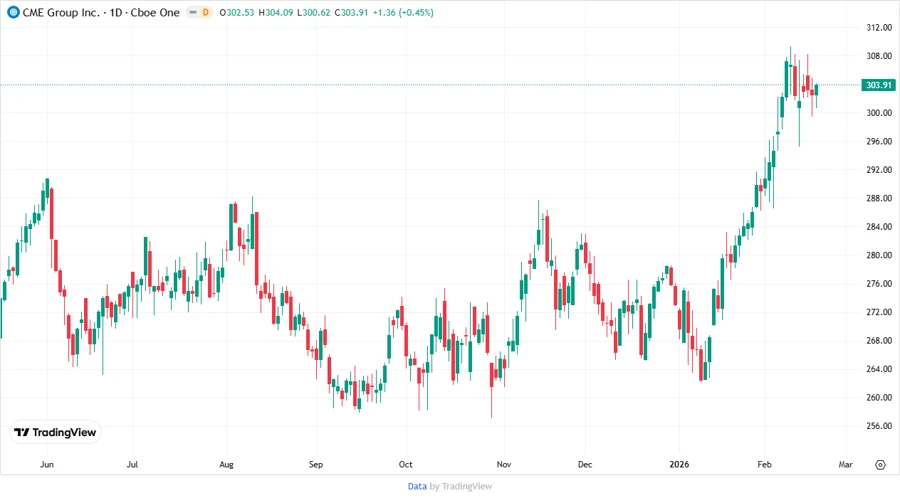
Price Development
Dividend Scoring System
| Category | Score (out of 5) | Score Bar |
|---|---|---|
| Dividend yield | 4 | |
| Dividend Stability | 3 | |
| Dividend growth | 2 | |
| Payout ratio | 4 | |
| Financial stability | 4 | |
| Dividend continuity | 3 | |
| Cashflow Coverage | 3 | |
| Balance Sheet Quality | 5 |
Total Score: 28 / 40
Rating
In conclusion, CME Group Inc. demonstrates a stable dividend profile with good yield supported by robust cash flows. While recent growth fluctuations caution, the overall financial health and strategic management offer a positive outlook, warranting a consideration for dividend-seeking investors.
Smart Data Insight
Master the Perfect Entry & Exit for this Stock
Don't leave your profits to chance. Historically, this stock follows specific seasonal patterns that institutional traders use to maximize returns.
- ✅ Identify the "Golden Buying Window"
- ✅ Avoid high-risk correction cycles
- ✅ Backtested data from the last 20+ years